Strategi Trend Palang Kematian Palang Emas EMA Berganda
Tarikh penciptaan:
2023-12-29 15:46:15
Akhirnya diubah suai:
2023-12-29 15:46:15
Salin:
2
Bilangan klik:
835
1
fokus pada
1750
Pengikut
Gambaran keseluruhan
Strategi ini menggunakan mata wang EMA ganda untuk menentukan arah trend semasa, dan digabungkan dengan RSI untuk mengelakkan kehilangan peluang jual beli.
Prinsip Strategi
- Mengira garis purata EMA untuk tempoh 10 dan 20, dinamakan sebagai ma00 dan ma01
- Apabila ma00 memakai ma01 menghasilkan isyarat beli
- Apabila ma00 di bawah menembusi ma01 menghasilkan isyarat menjual
- Pada masa yang sama, apabila harga naik ke ma00, ia akan menghasilkan isyarat beli jika ma00 lebih tinggi daripada ma01
- Begitu juga, apabila harga berada di bawah ma00, jika ma00 berada di bawah ma01, ia akan menghasilkan isyarat jual
- Dengan pertimbangan yang berlainan ini, anda boleh mengelakkan kehilangan beberapa titik jual beli.
- Tetapkan harga stop loss dan stop loss untuk mengawal risiko
Analisis kelebihan
- Menggunakan penilaian dua EMA untuk menyaring penembusan palsu
- Penghakiman berganda untuk mengelakkan borang kosong
- Tetapan Stop Loss yang baik untuk kawalan risiko
Analisis risiko
- Strategi EMA rata-rata berganda adalah strategi trend-following, sering dibeli dan dijual dalam keadaan goyah, mudah terhenti
- Tidak dapat menentukan dengan tepat titik perubahan trend, yang boleh menyebabkan kerugian
- Tetapan titik hentian yang tidak betul boleh meningkatkan kerugian
Arah pengoptimuman
- Anda boleh mengoptimumkan kitaran EMA dengan sewajarnya untuk mencari kombinasi parameter terbaik
- Ia boleh ditambah dengan penilaian lain untuk meningkatkan kestabilan strategi.
- Anda boleh menetapkan Hentian Bergerak dan menyesuaikan Hentian anda secara langsung dengan turun naik pasaran
Kod sumber strategi
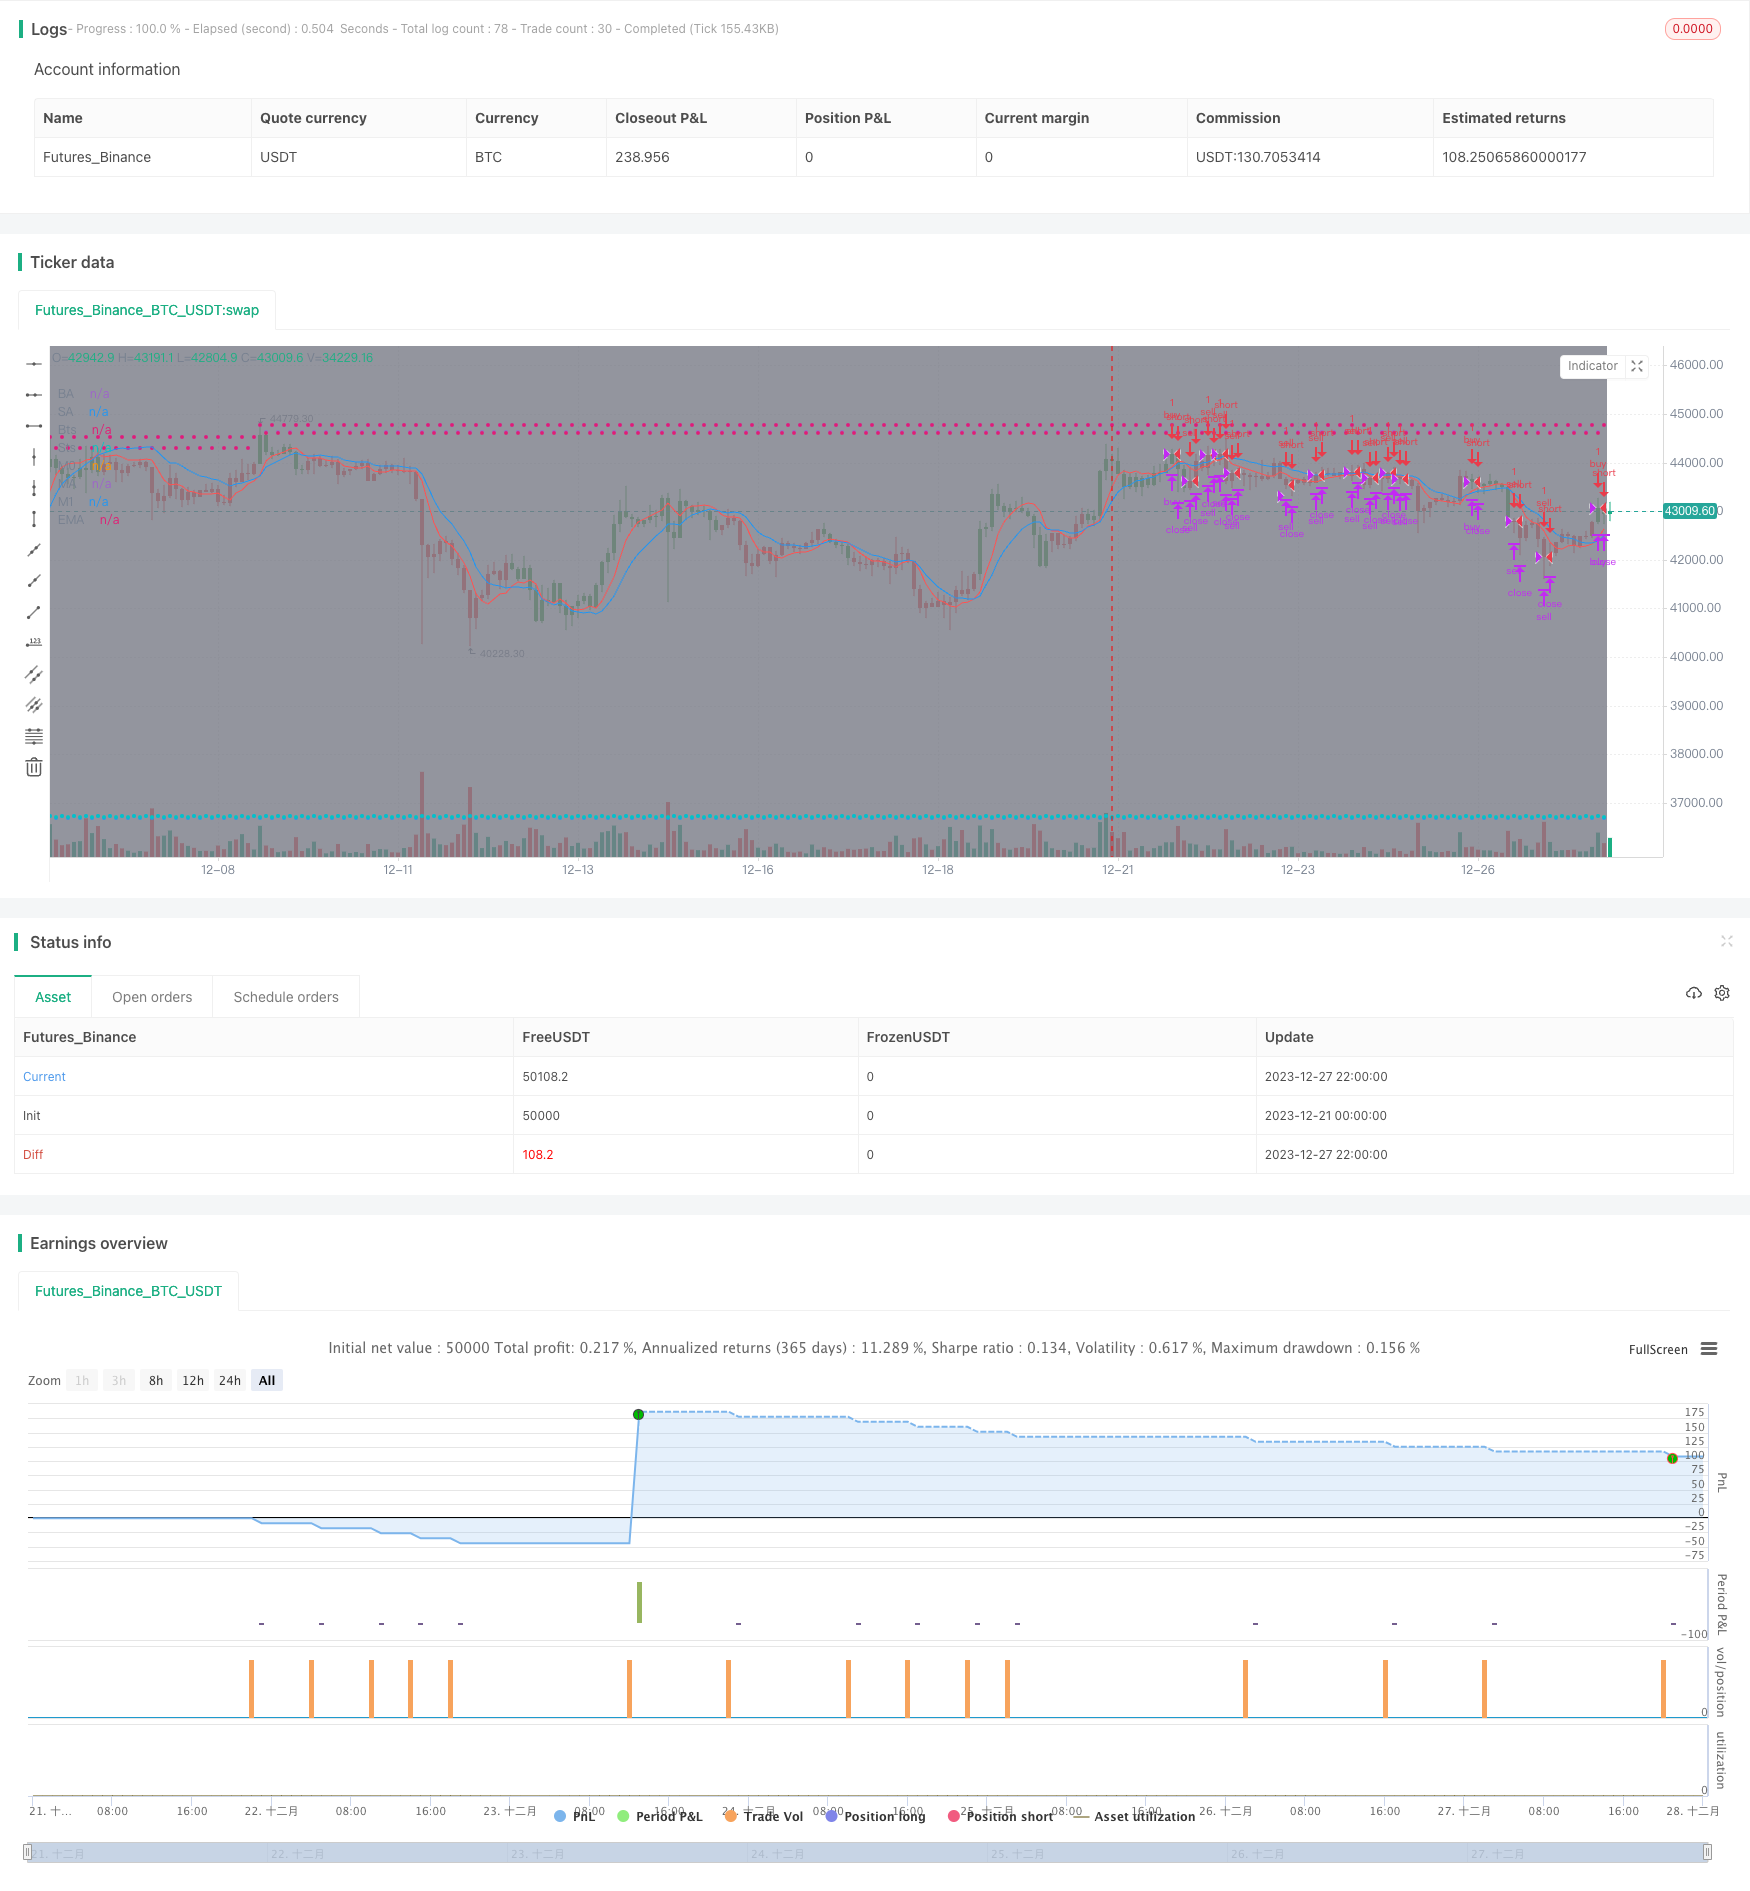
/*backtest
start: 2023-12-21 00:00:00
end: 2023-12-28 00:00:00
period: 2h
basePeriod: 15m
exchanges: [{"eid":"Futures_Binance","currency":"BTC_USDT"}]
*/

//@version=4

strategy(title='[STRATEGY][RS]MicuRobert EMA cross V1', shorttitle='S', overlay=true, pyramiding=0, initial_capital=100000)
USE_TRADESESSION = input(title='Use Trading Session?', type=bool, defval=true)
USE_TRAILINGSTOP = input(title='Use Trailing Stop?', type=bool, defval=true)
trade_session = input(title='Trade Session:',  defval='0400-1500', confirm=false)
istradingsession = not USE_TRADESESSION ? false : not na(time('1', trade_session))
bgcolor(istradingsession?color.gray:na)
trade_size = input(title='Trade Size:', type=float, defval=1)
tp = input(title='Take profit in pips:', type=float, defval=55.0) * (syminfo.mintick*10)
sl = input(title='Stop loss in pips:', type=float, defval=11.0) * (syminfo.mintick*10)
ma_length00 = input(title='EMA length:',  defval=10)
ma_length01 = input(title='DEMA length:',  defval=20)
price = input(title='Price source:', defval=open)

//  ||--- NO LAG EMA, Credit LazyBear:  ---||
f_LB_zlema(_src, _length)=>
    _ema1=ema(_src, _length)
    _ema2=ema(_ema1, _length)
    _d=_ema1-_ema2
    _zlema=_ema1+_d
//  ||-------------------------------------||

ma00 = f_LB_zlema(price, ma_length00)
ma01 = f_LB_zlema(price, ma_length01)
plot(title='M0', series=ma00, color=black)
plot(title='M1', series=ma01, color=black)

isnewbuy = change(strategy.position_size)>0 and change(strategy.opentrades)>0
isnewsel = change(strategy.position_size)<0 and change(strategy.opentrades)>0

buy_entry_price = isnewbuy ? price : buy_entry_price[1]
sel_entry_price = isnewsel ? price : sel_entry_price[1]
plot(title='BE', series=buy_entry_price, style=circles, color=strategy.position_size <= 0 ? na : aqua)
plot(title='SE', series=sel_entry_price, style=circles, color=strategy.position_size >= 0 ? na : aqua)
buy_appex = na(buy_appex[1]) ? price : isnewbuy ? high : high >= buy_appex[1] ? high : buy_appex[1]
sel_appex = na(sel_appex[1]) ? price : isnewsel ? low : low <= sel_appex[1] ? low : sel_appex[1]
plot(title='BA', series=buy_appex, style=circles, color=strategy.position_size <= 0 ? na : teal)
plot(title='SA', series=sel_appex, style=circles, color=strategy.position_size >= 0 ? na : teal)
buy_ts = buy_appex - sl
sel_ts = sel_appex + sl
plot(title='Bts', series=buy_ts, style=circles, color=strategy.position_size <= 0 ? na : red)
plot(title='Sts', series=sel_ts, style=circles, color=strategy.position_size >= 0 ? na : red)

buy_cond1 = crossover(ma00, ma01) and (USE_TRADESESSION ? istradingsession : true)
buy_cond0 = crossover(price, ma00) and ma00 > ma01 and (USE_TRADESESSION ? istradingsession : true)
buy_entry = buy_cond1 or buy_cond0
buy_close = (not USE_TRAILINGSTOP ? false : low <= buy_ts) or high>=buy_entry_price+tp//high>=last_traded_price + tp or low<=last_traded_price - sl //high >= hh or
sel_cond1 = crossunder(ma00, ma01) and (USE_TRADESESSION ? istradingsession : true)
sel_cond0 = crossunder(price, ma00) and ma00 < ma01 and (USE_TRADESESSION ? istradingsession : true)
sel_entry = sel_cond1 or sel_cond0
sel_close = (not USE_TRAILINGSTOP ? false : high >= sel_ts) or low<=sel_entry_price-tp//low<=last_traded_price - tp or high>=last_traded_price + sl //low <= ll or

strategy.entry('buy', long=strategy.long, qty=trade_size, comment='buy', when=buy_entry)
strategy.close('buy', when=buy_close)
strategy.entry('sell', long=strategy.short, qty=trade_size, comment='sell', when=sel_entry)
strategy.close('sell', when=sel_close)

//What i add .!
pos = iff(ma01 < ma00 , 1,
	    iff(ma01 > ma00 , -1, nz(pos[1], 0)))
barcolor(pos == -1 ? red: pos == 1 ? green : blue)
plot(ma00, color=red, title="MA")
plot(ma01, color=blue, title="EMA")