Strategi perdagangan kuantitatif berdasarkan Bollinger Bands dan VWAP
Gambaran keseluruhan
Strategi ini menggabungkan kedua-dua indikator Brin Belt ((BB) dan purata nilai kuantiti harga tipikal ((VWAP) untuk membuat keputusan membeli dan menjual. Ia boleh menemui ketidaksamaan harga jangka pendek dan kemudian berdagang, sesuai untuk perdagangan garis pendek.
Prinsip Strategi
Strategi ini adalah untuk membeli dan menjual berdasarkan peraturan berikut:
Garis EMA pantas lebih tinggi daripada garis EMA perlahan sebagai prasyarat untuk menilai trend
Apabila harga penutupan lebih tinggi daripada VWAP dinilai sebagai kenaikan harga dan dibeli
Jika 10 baris K sebelum ini mempunyai harga penutupan yang lebih rendah daripada Brin, ia dianggap sebagai pembelian yang luar biasa
Apabila harga penutupan lebih tinggi daripada Brin di atas landasan, harga telah ditukar dan dijual
Khususnya, strategi pertama menilai EMA 50 hari lebih tinggi daripada EMA 200 hari, menggunakan EMA perlahan untuk menilai tren besar. Kemudian, digabungkan dengan VWAP untuk menentukan sama ada harga berada dalam trend menaik dalam jangka pendek.
Peraturan keluar adalah lebih mudah, iaitu apabila harga lebih tinggi daripada Bollinger Bands, maka harga telah berbalik dan keluar.
Analisis kelebihan
Strategi ini menggabungkan kecacatan harga penilaian pelbagai petunjuk untuk meningkatkan keberkesanan isyarat masuk. Menggunakan EMA untuk menentukan trend besar dapat mengelakkan operasi berlawanan.
Analisis risiko
- EMA menilai keputusan trend besar tidak boleh menyebabkan operasi besar berlawanan
- Indeks VWAP paling baik digunakan untuk kesan data jam atau harian, dengan diskaun jika digunakan untuk kesan data garis harian
- Parameter pita Brin yang tidak betul, sekatan atas dan bawah yang terlalu lebar atau terlalu sempit akan menyebabkan isyarat tersalah
Untuk menghadapi risiko-risiko ini, anda boleh menyesuaikan parameter kitaran EMA atau mencuba indikator penghakiman trend besar yang lain. Parameter VWAP digunakan untuk data dalam sehari atau disesuaikan dengan indikator garis pendek yang lain.
Arah pengoptimuman
- Cubalah dengan penunjuk lain untuk melihat trend besar, seperti MACD
- Mengoptimumkan EMA dan parameter Brin untuk mencari konfigurasi terbaik
- Meningkatkan mekanisme kawalan kerugian
- Gabungan dengan penapis isyarat palsu
- Uji varieti dan data kitaran yang berbeza
ringkaskan
Strategi ini menggabungkan kedua-dua indikator Brin Belt dan VWAP untuk menilai ketidaksamaan harga jangka pendek sebagai masa masuk. Menggunakan EMA untuk menilai trend besar untuk mengelakkan operasi berlawanan.
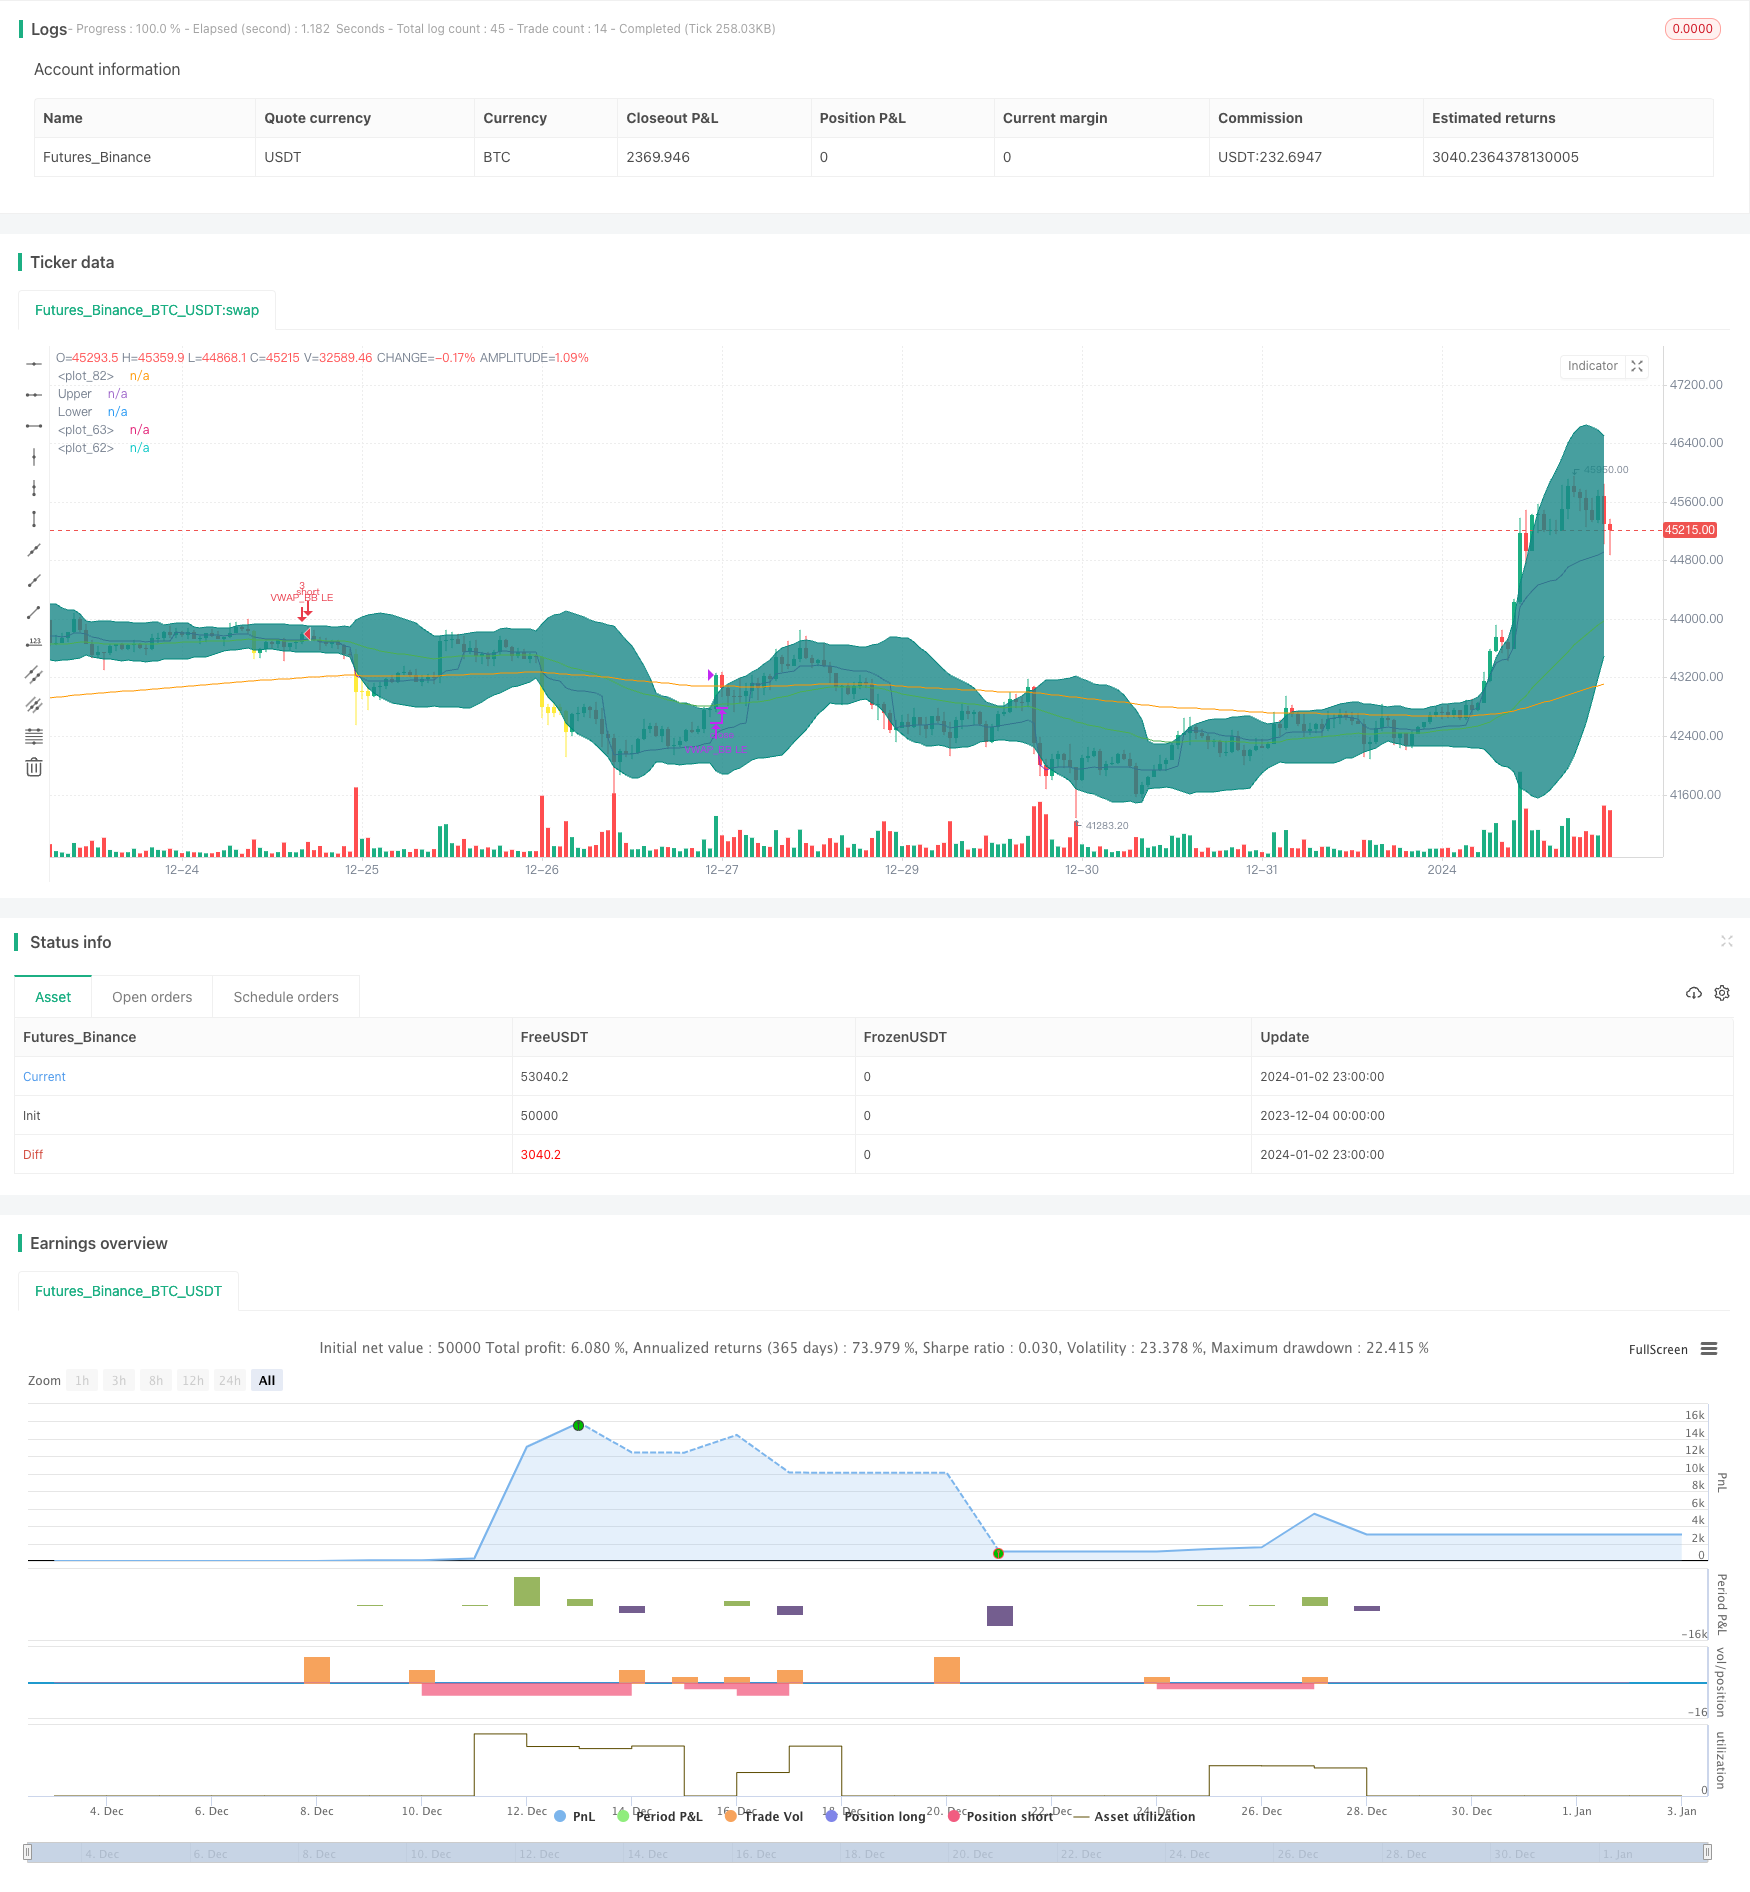
/*backtest
start: 2023-12-04 00:00:00
end: 2024-01-03 00:00:00
period: 1h
basePeriod: 15m
exchanges: [{"eid":"Futures_Binance","currency":"BTC_USDT"}]
*/

// This source code is subject to the terms of the Mozilla Public License 2.0 at https://mozilla.org/MPL/2.0/
// © mohanee

//@version=4
strategy(title="VWAP and BB strategy [EEMANI]", overlay=true,pyramiding=2, default_qty_value=3, default_qty_type=strategy.fixed,    initial_capital=10000, currency=currency.USD)
//This strategy combines VWAP and BB indicators
//BUY RULE
//1. EMA50 > EMA 200
//2. if current close > vwap session  value
//3. check if  price dipped BB lower band for any of last 10 candles
//EXIT RULE
//1. price closes above BB upper band
//STOP LOSS EXIT
//1. As configured --- default is set to 5%

is_price_dipped_bb(pds,source1) =>
    t_bbDipped=false
    for i=1 to pds
        t_bbDipped:=  (t_bbDipped   or  close[i]<source1) ? true : false
        if t_bbDipped==true
            break
        else
            continue

    t_bbDipped

// variables  BEGIN
shortEMA = input(50, title="fast EMA", minval=1)
longEMA = input(200, title="slow EMA", minval=1)

//BB

smaLength = input(20, title="BB SMA Length", minval=1)
bbsrc = input(close, title="BB Source")


//addOnDivergence = input(true,title="Add to existing on Divergence")
//exitOption = input(title="exit on RSI or BB", type=input.string, options=["RSI", "BB"],      defval="BB")

//bbSource = input(title="BB  source", type=input.string, options=["close", "vwap"],      defval="close")

//vwap_res = input(title="VWAP Resolution", type=input.resolution, defval="session")
stopLoss = input(title="Stop Loss%", defval=5, minval=1)

//variables  END


longEMAval= ema(close, longEMA)
shortEMAval= ema(close, shortEMA)


vwapVal=vwap(close)


// Drawings

//plot emas
plot(longEMAval, color = color.orange, linewidth = 1, transp=0)
plot(shortEMAval, color = color.green, linewidth = 1, transp=0)


//bollinger calculation
mult = input(2.0, minval=0.001, maxval=50, title="StdDev")
basis = sma(bbsrc, smaLength)
dev = mult * stdev(bbsrc, smaLength)
upperBand = basis + dev
lowerBand = basis - dev
offset = input(0, "Offset", type = input.integer, minval = -500, maxval = 500)
//bollinger calculation

//plot bb
//plot(basis, "Basis", color=#872323, offset = offset)
p1 = plot(upperBand, "Upper", color=color.teal, offset = offset)
p2 = plot(lowerBand, "Lower", color=color.teal, offset = offset)
fill(p1, p2, title = "Background", color=#198787, transp=95)


plot(vwapVal, color = color.purple, linewidth = 1, transp=0)


// Colour background

barcolor(shortEMAval>longEMAval and close<=lowerBand ? color.yellow: na)


//longCondition=  shortEMAval > longEMAval and  close>open and  close>vwapVal
longCondition= shortEMAval >= longEMAval  and  close>=vwapVal and close>open  //      close>vwapVal   and


//Entry
strategy.entry(id="VWAP_BB LE", comment="VB LE" , long=true,  when= longCondition and  is_price_dipped_bb(10,lowerBand) )  //and strategy.position_size<1

//add to the existing position
//strategy.entry(id="VWAP_RSI LE", comment="VR LE Add" , long=true,  when= addOnDivergence==true and strategy.position_size>=1 and close<strategy.position_avg_price   and (close<lowerBand or  low<lowerBand) and rsiVal>rsi_buy_line)

barcolor(strategy.position_size>=1  ? color.blue: na)


strategy.close(id="VWAP_BB LE", comment="TP Exit VB LE",   when=crossover(close,upperBand) )

//stoploss
stopLossVal =   strategy.position_avg_price * (1-(stopLoss*0.01) )
strategy.close(id="VB LE", comment="SL Exit",   when= close < stopLossVal)