Strategi perdagangan bingkai berbilang masa berdasarkan RSI dan purata bergerak
Gambaran keseluruhan
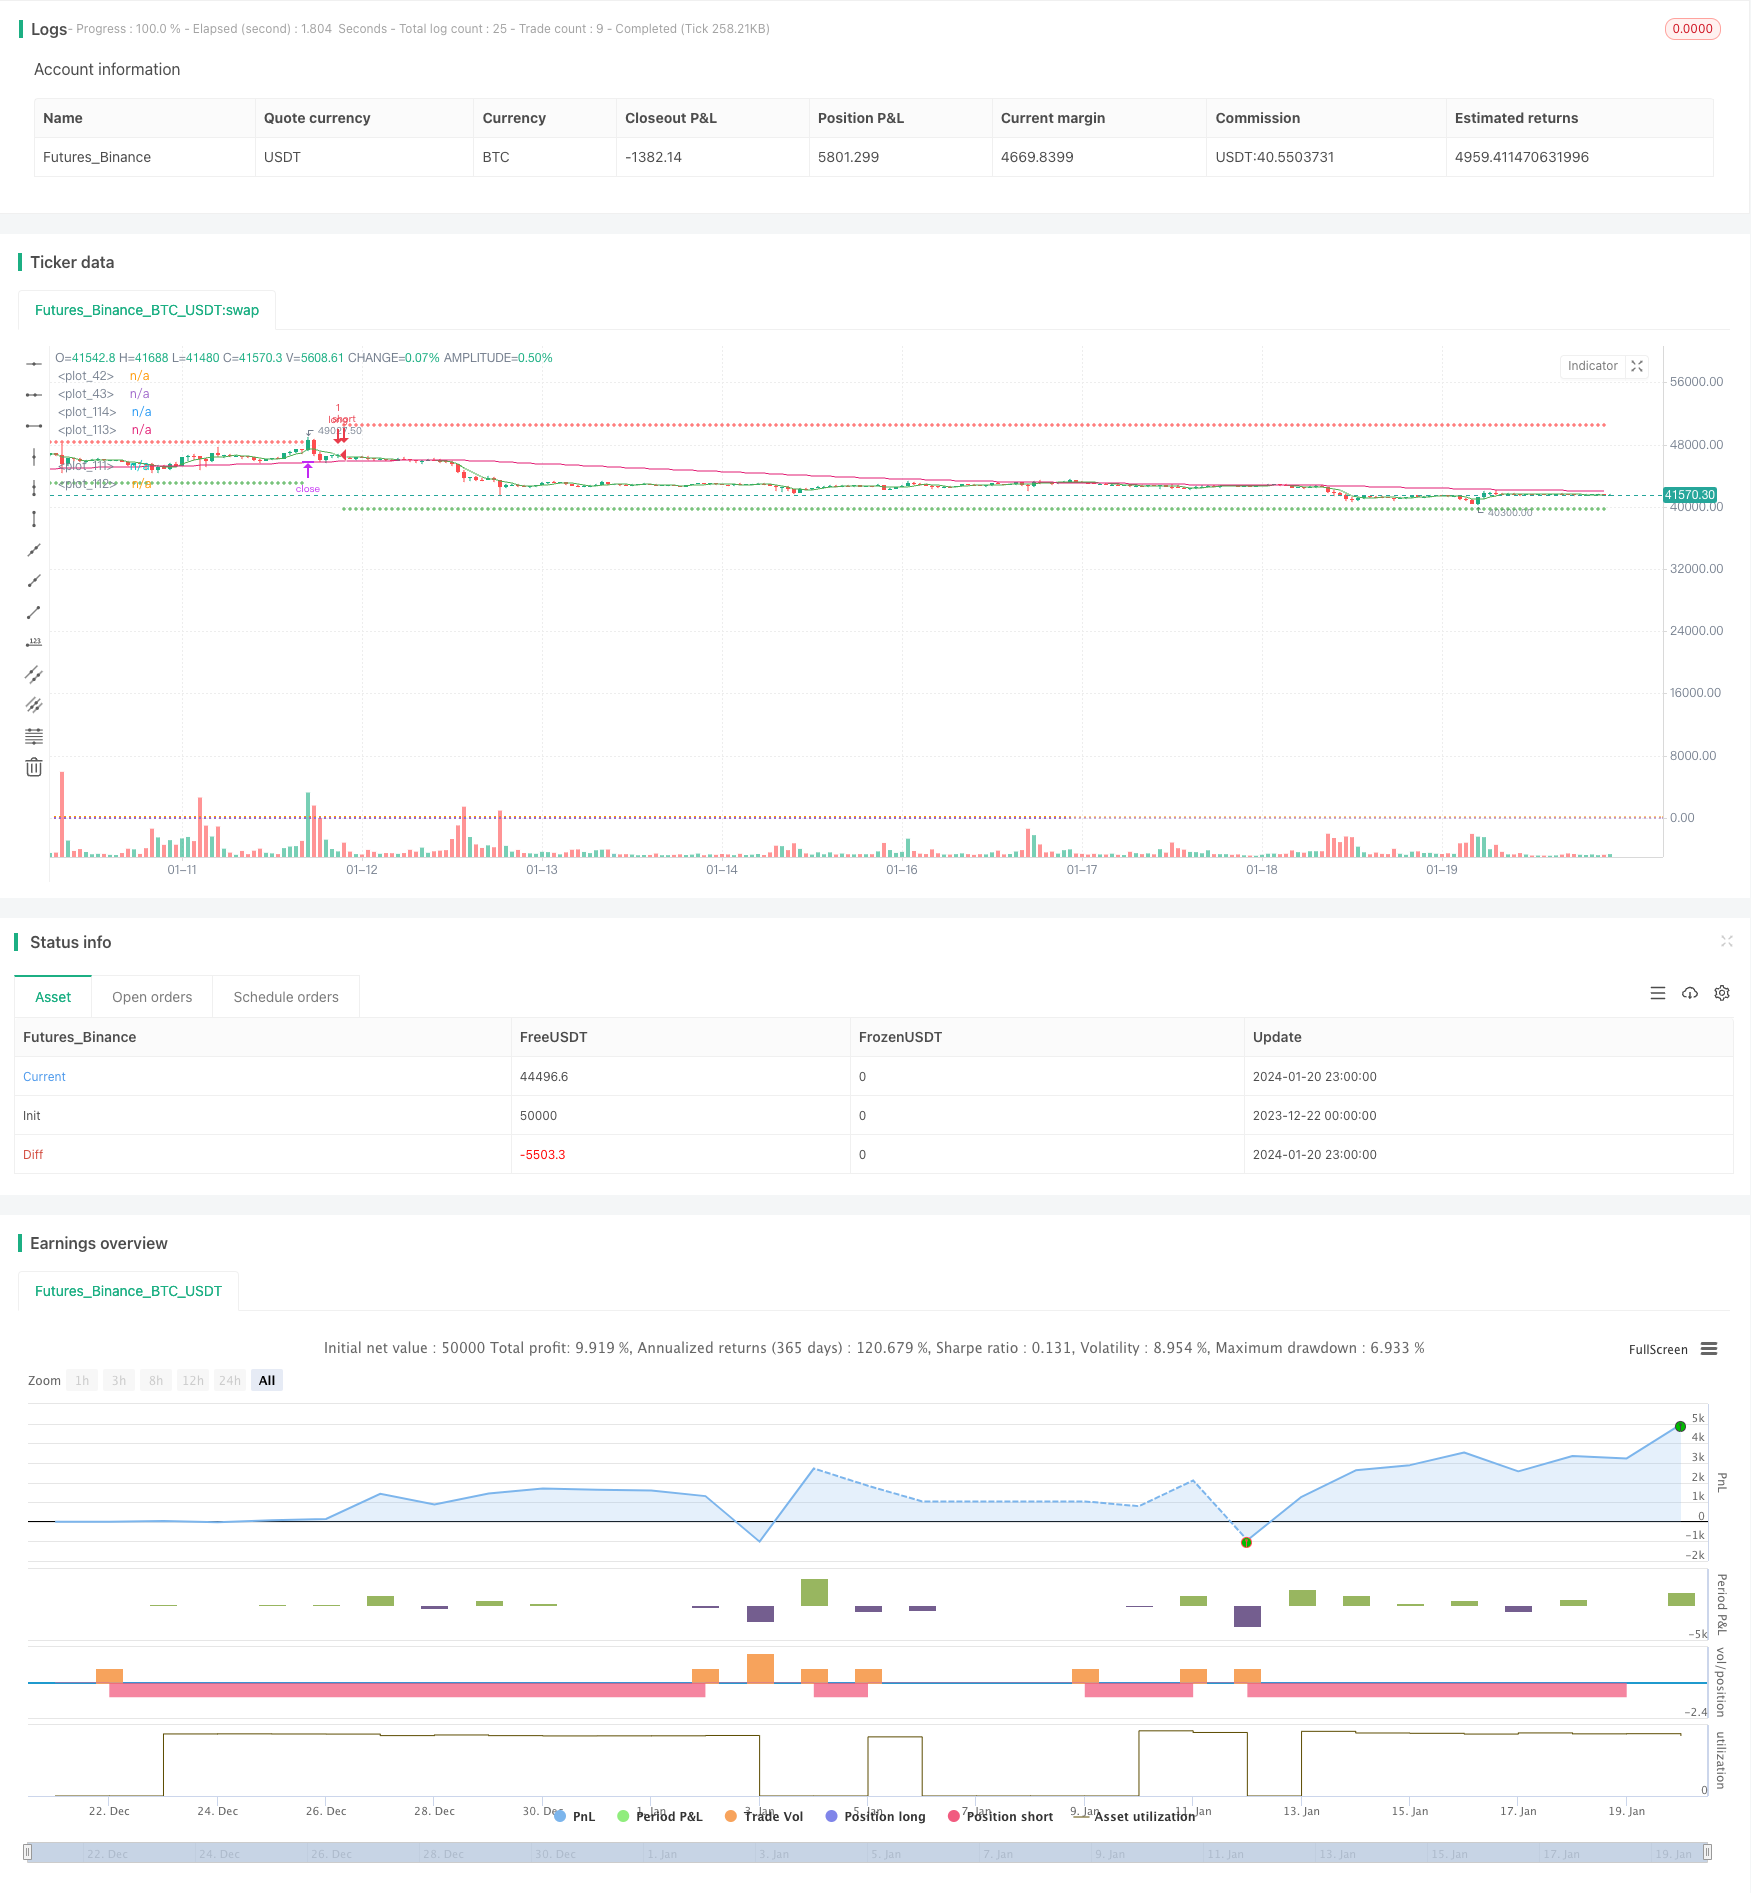
Strategi ini menggabungkan RSI acak, SMA bergerak dan WMA bergerak bertimbangan untuk mencari isyarat beli dan jual. Ia menilai arah trend pada jangka masa 5 minit dan 1 jam pada masa yang sama. Dalam trend yang mantap, isyarat perdagangan dihasilkan apabila RSI garis cepat melintasi atau melintasi garis perlahan.
Prinsip Strategi
Strategi ini mula-mula mengira 144 kitaran purata bergerak bertimbangan WMA dan 5 kitaran purata bergerak sederhana SMA pada dua bingkai masa 1 jam dan 5 minit. Hanya apabila SMA 5 minit berada di atas WMA, ia dianggap sebagai pasaran berbilang. Kemudian strategi mengira indikator polygonal RSI, serta garis K dan garis D yang sesuai.
Analisis kelebihan
Ini adalah strategi pengesanan trend yang sangat berkesan. Ia menggabungkan kedua-dua trend penghakiman bingkai masa pada masa yang sama, sangat berkesan mengurangkan isyarat yang salah. Di samping itu, ia menggabungkan pelbagai penunjuk penapis, termasuk RSI, SMA dan WMA, untuk menjadikan isyarat lebih dipercayai. Dengan membiarkan RSI memandu KDJ, ia juga mengubah suai masalah isyarat palsu yang mudah dihasilkan dalam strategi KDJ biasa.
Analisis risiko
Risiko terbesar dalam strategi ini adalah kesalahan dalam menilai trend. Pada titik peralihan pasaran, purata jangka pendek dan jangka panjang mungkin naik atau turun secara serentak, menghasilkan isyarat yang salah. Di samping itu, dalam keadaan goyah, RSI juga mungkin menghasilkan lebih banyak isyarat perdagangan yang tidak jelas.
Arah pengoptimuman
Strategi ini boleh dioptimumkan dalam beberapa aspek: 1) Uji panjang SMA, WMA dan RSI untuk mencari kombinasi parameter terbaik 2) Tambah penilaian lain seperti MACD, Brinline dan lain-lain untuk mengesahkan kebolehpercayaan isyarat 3) Mengoptimumkan strategi hentian hentian, menguji hentian peratusan tetap, hentian titik slippage, dan cara untuk mengesan hentian 4) Menyertai modul pengurusan wang, mengawal saiz pelaburan individu dan risiko keseluruhan 5) Menambah algoritma pembelajaran mesin untuk mencari parameter yang paling baik melalui banyak pengulangan
ringkaskan
Strategi ini memanfaatkan sepenuhnya kelebihan rata-rata bergerak dan petunjuk rawak untuk membina sistem pengesanan trend yang lebih dipercayai. Melalui beberapa bingkai masa dan pengesahan indikator, ia dapat menangkap arah trend garis tengah dan panjang dengan lancar.
/*backtest
start: 2023-12-22 00:00:00
end: 2024-01-21 00:00:00
period: 1h
basePeriod: 15m
exchanges: [{"eid":"Futures_Binance","currency":"BTC_USDT"}]
*/

// This source code is subject to the terms of the Mozilla Public License 2.0 at https://mozilla.org/MPL/2.0/
// © bufirolas

// Works well with a wide stop with 20 bars lookback
// for the SL level and a 2:1 reward ratio Take Profit .
// These parameters can be modified in the Inputs section of the strategy panel.

// "an entry signal it's a cross down or up on
// the stochastics. if you're in a downtrend
// on the hourly time frame you
// must also be in a downtrend on the five
// minute so the five period has to be below the 144
// as long as the five period is still trading below
// the 144 period on both the hourly and the five minutes
// we are looking for these short signals crosses down
// in the overbought region of the stochastic. Viceversa for longs"

//@version=4
strategy("Stoch + WMA + SMA strat", overlay=true)

//SL & TP Inputs
i_SL=input(true, title="Use Swing Lo/Hi Stop Loss & Take Profit")
i_SwingLookback=input(20, title="Swing Lo/Hi Lookback")
i_SLExpander=input(defval=10, step=1, title="SL Expander")
i_TPExpander=input(defval=30, step=1, title="TP Expander")
i_reverse=input(false, title="Reverse Trades")
i_TStop =input(false, title="Use Trailing Stop")

//Strategy Inputs
src4 = input(close, title="RSI Source")
stochOS=input(defval=20, step=5, title="Stochastics Oversold Level")
stochOB=input(defval=80, step=5, title="Stochastics Overbought Level")

//Stoch rsi Calculations
smoothK = input(3, minval=1)
smoothD = input(3, minval=1)
lengthRSI = input(14, minval=1)
lengthStoch = input(14, minval=1)
rsi1 = rsi(src4, lengthRSI)
k = sma(stoch(rsi1, rsi1, rsi1, lengthStoch), smoothK)
d = sma(k, smoothD)
h0 = hline(80, linestyle=hline.style_dotted)
h1 = hline(20, linestyle=hline.style_dotted)

//MA
wmalen=input(defval=144, title="WMA Length")
WMA = security(syminfo.tickerid, "60", wma(close, wmalen))
SMA = security(syminfo.tickerid, "60", sma(close, 5))
minWMA = wma(close, wmalen)
minSMA = sma(close, 5)

//Entry Logic
stobuy = crossover(k, d) and k < stochOS
stosell = crossunder(k, d) and k > stochOB
mabuy = minSMA > minWMA
daymabuy = SMA > WMA

//SL & TP Calculations
SwingLow=lowest(i_SwingLookback)
SwingHigh=highest(i_SwingLookback)
bought=strategy.position_size != strategy.position_size[1]
LSL=valuewhen(bought, SwingLow, 0)-((valuewhen(bought, atr(14), 0)/5)*i_SLExpander)
SSL=valuewhen(bought, SwingHigh, 0)+((valuewhen(bought, atr(14), 0)/5)*i_SLExpander)
lTP=(strategy.position_avg_price + (strategy.position_avg_price-(valuewhen(bought, SwingLow, 0)))+((valuewhen(bought, atr(14), 0)/5)*i_TPExpander))
sTP=(strategy.position_avg_price - (valuewhen(bought, SwingHigh, 0) - strategy.position_avg_price))-((valuewhen(bought, atr(14), 0)/5)*i_TPExpander)
islong=strategy.position_size > 0
isshort=strategy.position_size < 0

//TrailingStop
dif=(valuewhen(strategy.position_size>0 and strategy.position_size[1]<=0, high,0))
 -strategy.position_avg_price
trailOffset     = strategy.position_avg_price - LSL
var tstop = float(na)
if strategy.position_size > 0
    tstop := high- trailOffset - dif
    if tstop<tstop[1]
        tstop:=tstop[1]
else
    tstop := na
StrailOffset     = SSL - strategy.position_avg_price
var Ststop = float(na)
Sdif=strategy.position_avg_price-(valuewhen(strategy.position_size<0
 and strategy.position_size[1]>=0, low,0))
if strategy.position_size < 0
    Ststop := low+ StrailOffset + Sdif
    if Ststop>Ststop[1]
        Ststop:=Ststop[1]
else
    Ststop := na

//Stop Selector
SL= islong ? LSL : isshort ? SSL : na
if i_TStop
    SL:= islong ? tstop : isshort ? Ststop : na
TP= islong ? lTP : isshort ? sTP : na


//Entries
if stobuy and mabuy and daymabuy
    strategy.entry("long", long=not i_reverse?true:false)
if stosell and not mabuy and not daymabuy
    strategy.entry("short", long=not i_reverse?false:true)


//Exit
if i_SL
    strategy.exit("longexit", "long", stop=SL, limit=TP)
    strategy.exit("shortexit", "short", stop=SL, limit=TP)

//Plots
plot(i_SL ? SL : na, color=color.red, style=plot.style_cross)
plot(i_SL ? TP : na, color=color.green, style=plot.style_cross)
plot(minWMA)
plot(minSMA, color=color.green)