Penunjuk momentum dan strategi silang indeks ketakutan
Tarikh penciptaan:
2024-01-23 14:27:23
Akhirnya diubah suai:
2024-01-23 14:27:23
Salin:
3
Bilangan klik:
665
1
fokus pada
1750
Pengikut
Gambaran keseluruhan
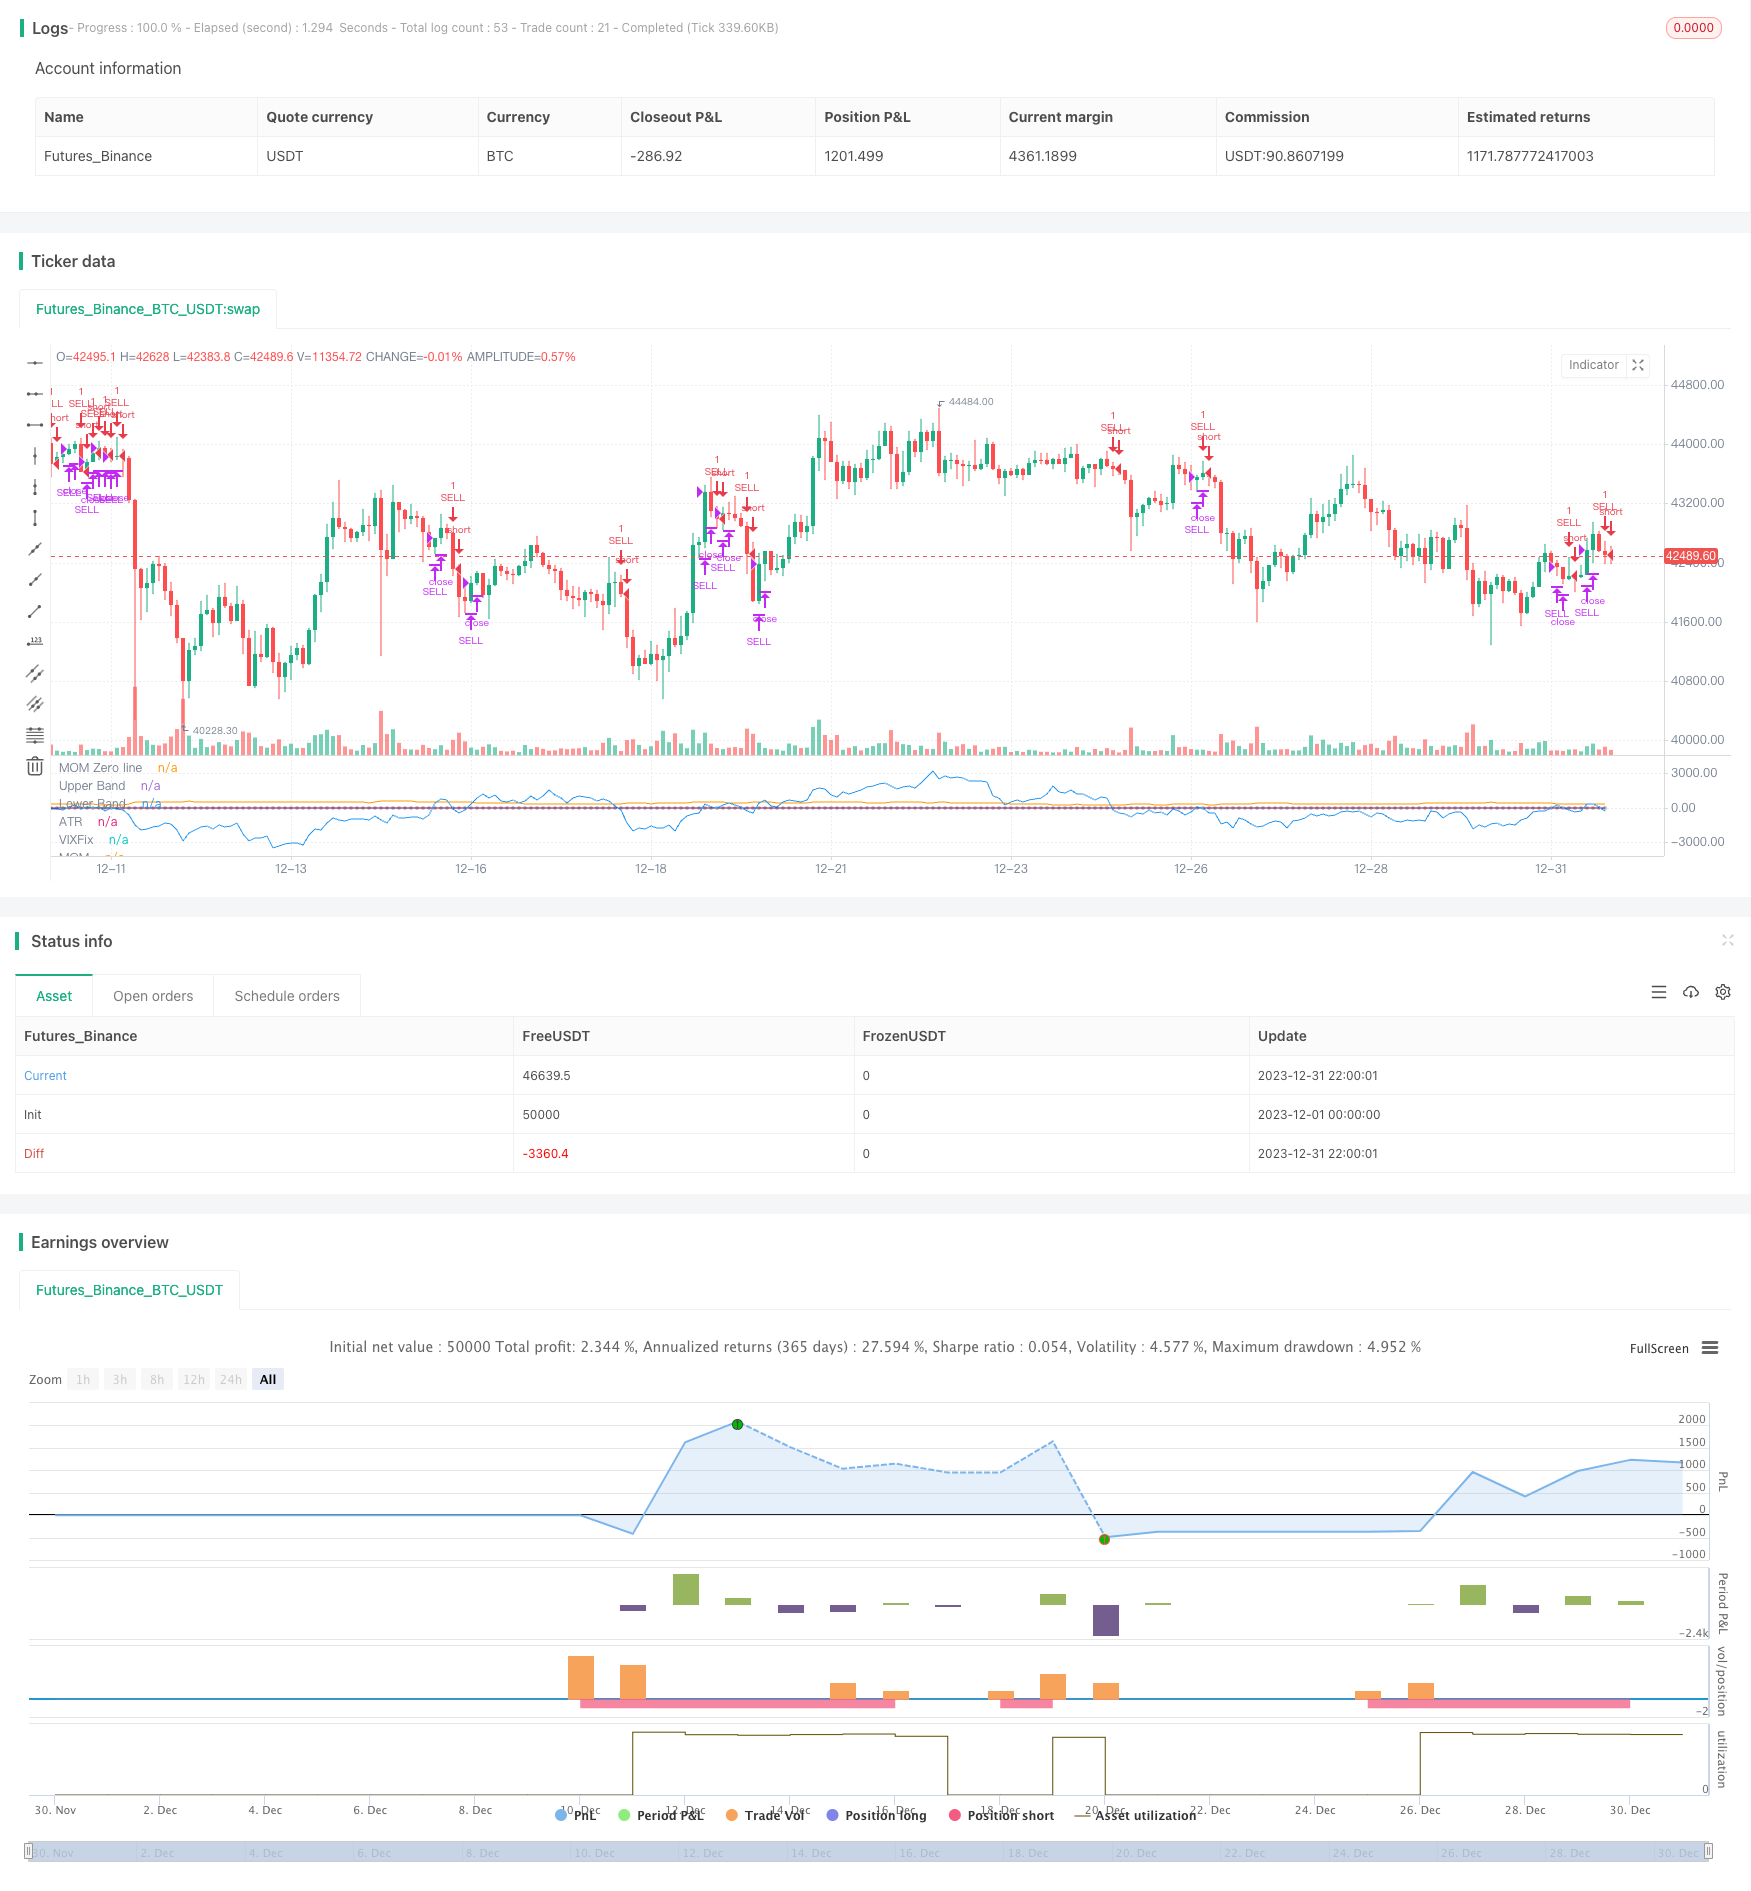
Strategi ini menilai pergerakan pasaran dengan mengira persilangan penunjuk momentum dan indeks panik, dan menghantar isyarat jual apabila dua penunjuk berlaku persilangan tertentu untuk menangkap penurunan yang besar.
Prinsip Strategi
- Hitung indikator pergerakan 50 kitaran. Ia menunjukkan perubahan harga berbanding sebelum 50 kitaran.
- Mengira nilai penyesuaian indeks panik 22 kitaran. Ia menunjukkan sentimen panik pasaran dengan nisbah harga tertinggi dan terendah.
- Apabila indikator momentum menembusi indeks panik, ia menunjukkan bahawa terdapat tekanan penurunan.
- Jika indikator momentum terus jatuh ke dalam zon bahaya (antara -5 dan 5), isyarat menjual yang kuat akan dikeluarkan.
Analisis kelebihan
- Indeks Kecemasan, yang merupakan indikator sentimen perdagangan pasaran, boleh digunakan untuk menilai perubahan struktur pasaran.
- Penunjuk dinamik boleh menilai kelajuan dan kekuatan perubahan harga, membantu menentukan perubahan trend pasaran.
- Gabungan dua jenis penunjuk boleh meningkatkan ketepatan pengiktirafan kejadian yang tidak dijangka.
- Dengan menyesuaikan parameter, anda boleh menyesuaikan diri dengan keadaan pasaran yang berbeza.
Analisis risiko
- Perkalian indeks panik dengan indeks momentum tidak menjamin penurunan yang ketara setiap kali. Ia perlu digabungkan dengan indikator lain untuk menentukan keputusan akhir.
- Tidak ada penempatan stop loss selepas jualan, tidak dapat mengawal kerugian dengan berkesan.
- Tidak dipertimbangkan untuk berbalik dan masuk semula ke pasaran.
Arah pengoptimuman
- Tetapkan titik hentian untuk mengawal kerugian selepas jualan.
- Menambah penghakiman petunjuk lain untuk meningkatkan kebolehpercayaan isyarat. seperti jumlah transaksi, garis Brin, dan lain-lain.
- Menambah isyarat masuk semula ke pasaran supaya strategi dapat beroperasi secara penuh dalam kitaran jangka panjang.
- Untuk mengoptimumkan parameter, cari kombinasi parameter terbaik.
ringkaskan
Strategi ini mengeluarkan amaran penurunan pasaran dengan penyeberangan indikator momentum dan indeks panik. Ia dapat menangkap penurunan mendadak di pasaran dengan berkesan. Tetapi strategi ini hanya sesuai untuk aplikasi garis pendek, tanpa mekanisme keluar dan kawalan risiko.
Kod sumber strategi
/*backtest
start: 2023-12-01 00:00:00
end: 2023-12-31 23:59:59
period: 2h
basePeriod: 15m
exchanges: [{"eid":"Futures_Binance","currency":"BTC_USDT"}]
*/

// This source code is subject to the terms of the Mozilla Public License 2.0 at https://mozilla.org/MPL/2.0/
// © gary_trades

//THIS SCRIPT HAS BEEN BUIL TO BE USED AS A S&P500 SPY CRASH INDICATOR (should not be used as a strategy).
//THIS SCRIPT HAS BEEN BUILT AS A STRATEGY FOR VISUALIZATION PURPOSES ONLY AND HAS NOT BEEN OPTIMISED FOR PROFIT.
//The script has been built to show as a lower indicator and also gives visual SELL signal on top when conditions are met. BARE IN MIND NO STOP LOSS, NOR ADVANCED EXIT STRATEGY HAS BEEN BUILT.
//As well as the chart SELL signal an alert has also been built into this script.
//The script utilizes a VIX indicator (marron line) and 50 period Momentum (blue line) and Danger/No trade zone(pink shading).
//When the Momentum line crosses down across the VIX this is a sell off but in order to only signal major sell offs the SELL signal only triggers if the momentum continues down through the danger zone.
//To use this indicator to identify ideal buying then you should only buy when Momentum line is crossed above the VIX and the Momentum line is above the Danger Zone.
//This is best used as a daily time frame indicator

//@version=4
strategy(title="S&P Bear Warning", shorttitle="Bear Warning" )

//Momentum
len = input(50, minval=1, title="Length")
src = input(close, title="Source")
bandUpper = input( 5)
bandLower = input(-5)
// ————— Control plotting of each signal. You could use the same technique to be able to turn acc/dist on/off.
showVixFix = input(true)
showMomentum = input(true)

mom = src - src[len]
myAtr = atr(14)
plot(showMomentum ? mom : na, color=color.blue, title="MOM")
plot(showMomentum ? 0 : na, color=color.silver, title="MOM Zero line", style=plot.style_circles, transp=100)
plot(showMomentum ? myAtr : na, color=color.orange, title="ATR", transp=90)

//VIX
VIXFixLength = input(22,title="VIX Fix Length")
VIXFix = (highest(close,VIXFixLength)-low)/(highest(close,VIXFixLength))*100
plot(showVixFix ? VIXFix : na, "VIXFix", color=color.maroon)

band1 = plot(showVixFix ? bandUpper : na, "Upper Band", color.red, 1, plot.style_line, transp=90)
band0 = plot(showVixFix ? bandLower : na, "Lower Band", color.red, 1, plot.style_line, transp=90)
fill(band1, band0, color=color.red, transp=85, title="Background")

//Identify Triggers
//Back Test Range
start = timestamp("America/New_York", 2000, 1, 1, 9,30)
end   = timestamp("America/New_York", 2020, 7, 1, 0, 0)

//Momentum
Long1 = mom > bandUpper
Short1 = mom < bandLower

//VIX
Long2  = crossover(mom, VIXFix)
Short2 = crossunder(mom, VIXFix)

//Warning Alert
SellAlert = Short1
alertcondition(SellAlert, title="Sell SPY", message="Warning Selling off {{ticker}}, price= {{close}}")

//Entry and Exit
if true
    strategy.entry("SELL", false, when = Short1)

strategy.close("SELL", when = Long2)