Strategi perbezaan berasaskan purata bergerak

1
Follow
1788
Followers
Gambaran keseluruhan
Strategi ini menggunakan pengiraan purata bergerak dan titik-titik pusatnya untuk mencari penyimpangan antara harga dan purata bergerak sebagai isyarat untuk membeli dan menjual. Ia boleh digunakan pada mana-mana penunjuk getaran untuk mencari penyimpangan.
Prinsip Strategi
- Pengiraan panjang sebagai purata bergerak Len (MA)
- Mengesan titik rendah (PL) dan titik tinggi (PH) pada MA
- Penilaian kewujudan deviasi positif: harga inovasi rendah dan MA tidak inovasi rendah atau harga tidak inovasi rendah dan MA inovasi rendah
- Menentukan sama ada terdapat kebalikan: harga tinggi dengan MA yang tidak inovatif atau harga tinggi dengan MA yang tidak inovatif
- Membeli dan menjual berdasarkan keadaan yang berbeza
Analisis kelebihan
- Mampu mengesan secara automatik perbezaan antara harga dan MA, mengelakkan kesalahan penilaian buatan
- Boleh digunakan untuk mana-mana penunjuk getaran, berskala tinggi
- Boleh digunakan untuk mengkaji semula kelayakan keuntungan strategi
- Parameter yang boleh dikonfigurasi menyesuaikan sensitiviti untuk mengelakkan isyarat yang salah
- Berbagai jenis penyingkiran untuk penilaian yang tepat dan menyeluruh
Analisis risiko
- Jika penunjuk getaran tidak ditetapkan dengan betul, ia boleh menghasilkan banyak isyarat salah
- Keadaan ini boleh berlaku apabila terdapat kurang isyarat yang diperlukan sebelum ia berlaku.
- Parameter perlu diselaraskan dengan betul untuk mengimbangi sensitiviti dan penapisan isyarat silap
- Penggunaan yang lebih baik dalam kombinasi dengan faktor-faktor lain, kurang dipercayai untuk digunakan secara bersendirian
Arah pengoptimuman
- Mengoptimumkan parameter purata bergerak untuk mencari kombinasi parameter terbaik
- Gabungan dengan petunjuk lain seperti petunjuk harga kuantiti untuk mengelakkan isyarat salah
- Menambah model pembelajaran mesin yang tidak boleh dipercayai
- Meningkatkan mekanisme pengurusan risiko untuk mengawal kerugian tunggal
ringkaskan
Strategi ini dapat mengotomatiskan penghakiman dan mengelakkan kesalahan subjektif dengan menemui penyingkiran antara harga dan purata bergerak sebagai isyarat perdagangan. Ia boleh digunakan secara meluas untuk mana-mana penunjuk getaran dan mempunyai skalabiliti yang kuat. Ia perlu digabungkan dengan pengoptimuman parameter dan digunakan dengan penunjuk lain, yang dapat meningkatkan kebolehpercayaan isyarat perdagangan dan kestabilan sistem.
Source
Pine
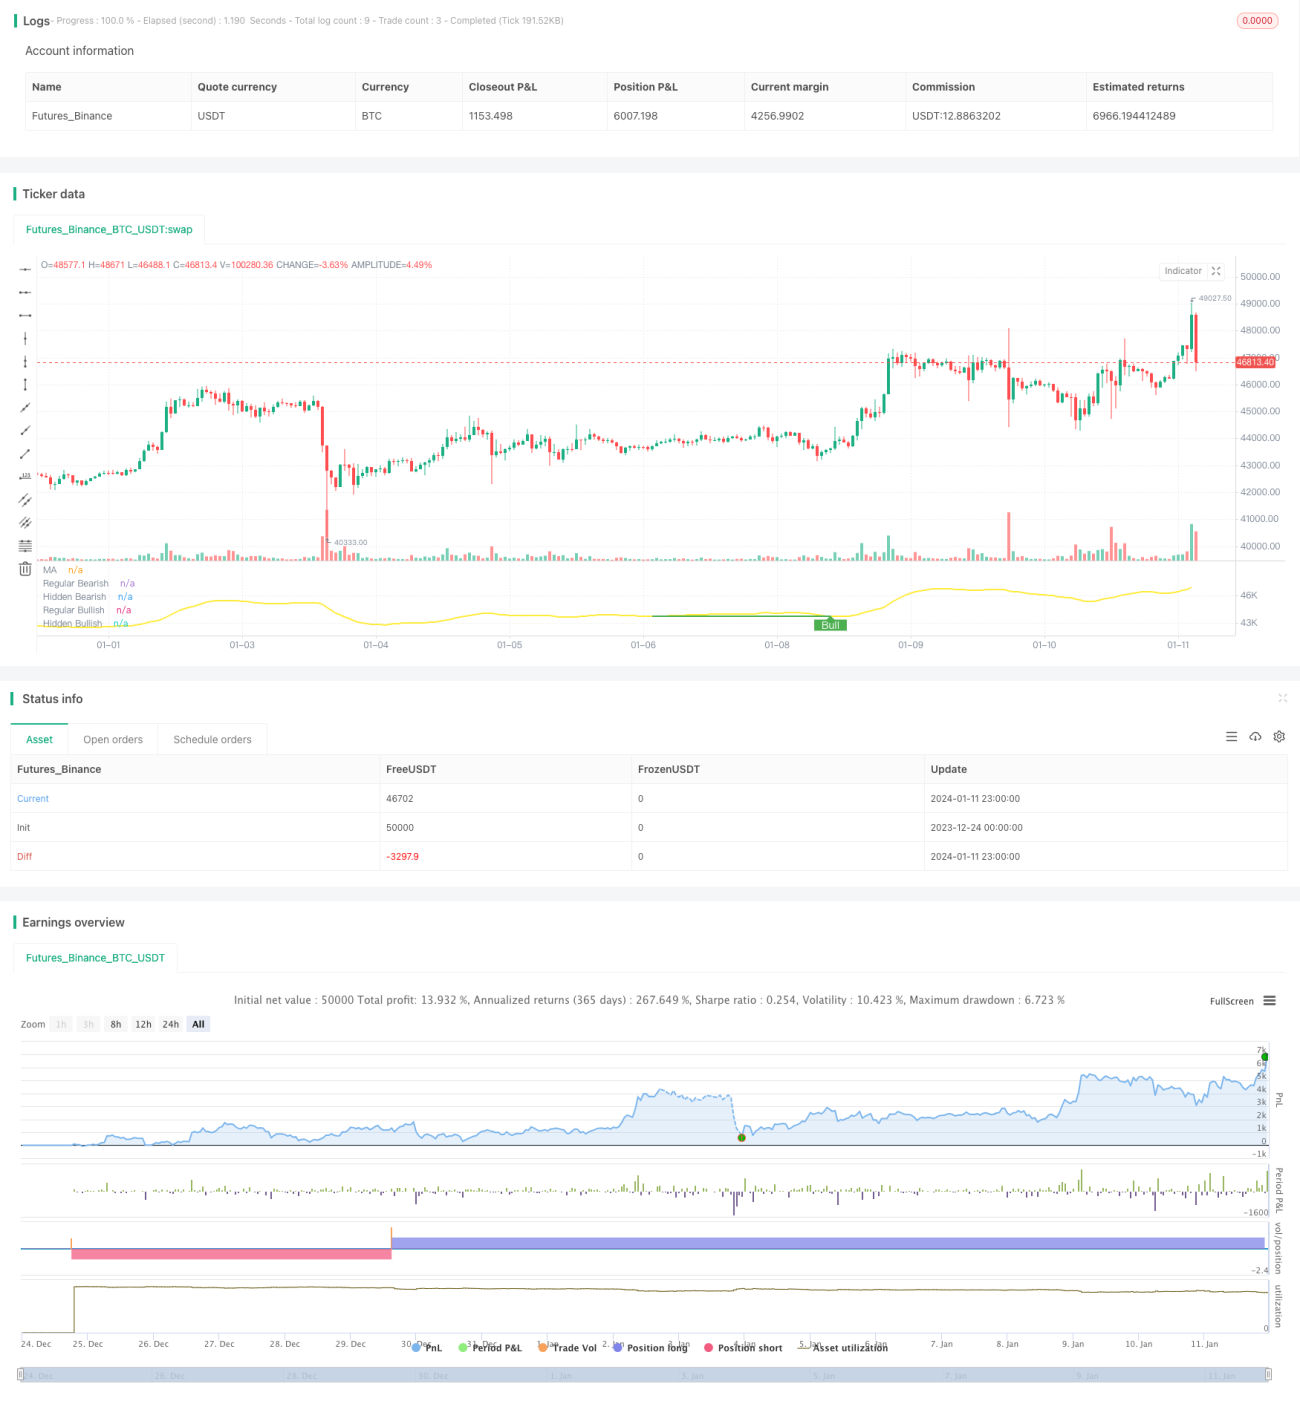
/*backtest
start: 2023-12-24 00:00:00
end: 2024-01-12 00:00:00
period: 1h
basePeriod: 15m
exchanges: [{"eid":"Futures_Binance","currency":"BTC_USDT"}]
*/

// This source code is subject to the terms of the Mozilla Public License 2.0 at https://mozilla.org/MPL/2.0/
// © tista
//https://www.tradingview.com/u/tista/#published-scripts
Strategy parameters
Related strategies
Comment
All comments (0)
No data
- 1