Strategi Perdagangan Swing Sokongan dan Rintangan
Tarikh penciptaan:
2024-01-25 15:53:06
Akhirnya diubah suai:
2024-01-25 15:53:06
Salin:
2
Bilangan klik:
603
1
fokus pada
1750
Pengikut
Gambaran keseluruhan
Strategi ini mewujudkan kawalan tepat logik perdagangan dan penangguhan kerugian tepat dengan menggabungkan strategi silang RSI, indikator rawak, dan strategi pengoptimuman titik pelupusan, dan dengan memperkenalkan pengoptimuman isyarat, anda dapat mengawal trend dengan lebih baik dan menguruskan dana anda dengan bijak.
Prinsip Strategi
- Indeks RSI menilai kawasan overbought dan oversold, dan membentuk isyarat perdagangan dengan nilai K dan D indikator acak.
- Pengenalan pengenalan jenis K-Line untuk membantu menilai isyarat trend dan mengelakkan perdagangan yang salah.
- Garis purata SMA membantu menentukan arah trend. Apabila garis purata jangka pendek dari bawah ke atas menembusi garis purata jangka panjang sebagai isyarat bullish.
- Strategi titik tergelincir kedudukan rata, menetapkan harga hentian kerugian berdasarkan julat pergerakan harga tertinggi dan terendah.
Analisis kelebihan
- Parameter RSI dioptimumkan untuk menilai kawasan overbought dan oversold dengan baik dan mengelakkan perdagangan yang salah
- Optimasi parameter penunjuk STO, penyesuaian parameter kelancaran, boleh menghapuskan bunyi bising dan meningkatkan kualiti isyarat
- Pengenalan analisis teknikal Heikin-Ashi untuk mengenal pasti perubahan arah entiti K-Line untuk memastikan ketepatan isyarat perdagangan
- Garis purata SMA membantu menentukan arah trend besar, mengelakkan dagangan berlawanan
- Menggabungkan strategi Stop Loss Slip Point dengan Stop Loss Slip Point, anda boleh memaksimumkan keuntungan setiap dagangan
Analisis risiko
- Dana Berhad Berhad Berhad Berhad Berhad
- Frekuensi dagangan mungkin terlalu tinggi, meningkatkan kos transaksi dan kos slippage
- Indeks RSI mudah membentuk isyarat palsu dan harus disaring dengan penunjuk lain
Pengoptimuman Strategi
- Menyesuaikan parameter RSI untuk mengoptimumkan penilaian overbought dan oversold
- Sesuaikan parameter penunjuk STO, kelancaran dan kitaran untuk meningkatkan kualiti isyarat
- Menyesuaikan kitaran purata bergerak, mengoptimumkan penghakiman trend
- Memperkenalkan lebih banyak penunjuk teknikal untuk meningkatkan ketepatan penilaian isyarat
- Mengoptimumkan Stop Loss Stop Loss Ratio untuk mengurangkan risiko transaksi tunggal
ringkaskan
Strategi ini mengintegrasikan kelebihan pelbagai petunjuk teknologi utama, mencapai keseimbangan antara kualiti isyarat perdagangan dan hentian hentian melalui pengoptimuman parameter dan penyempurnaan peraturan. Ia mempunyai kebolehgunaan dan keuntungan yang stabil. Dengan pengoptimuman berterusan, ia dapat meningkatkan lagi kemenangan dan keuntungan.
Kod sumber strategi
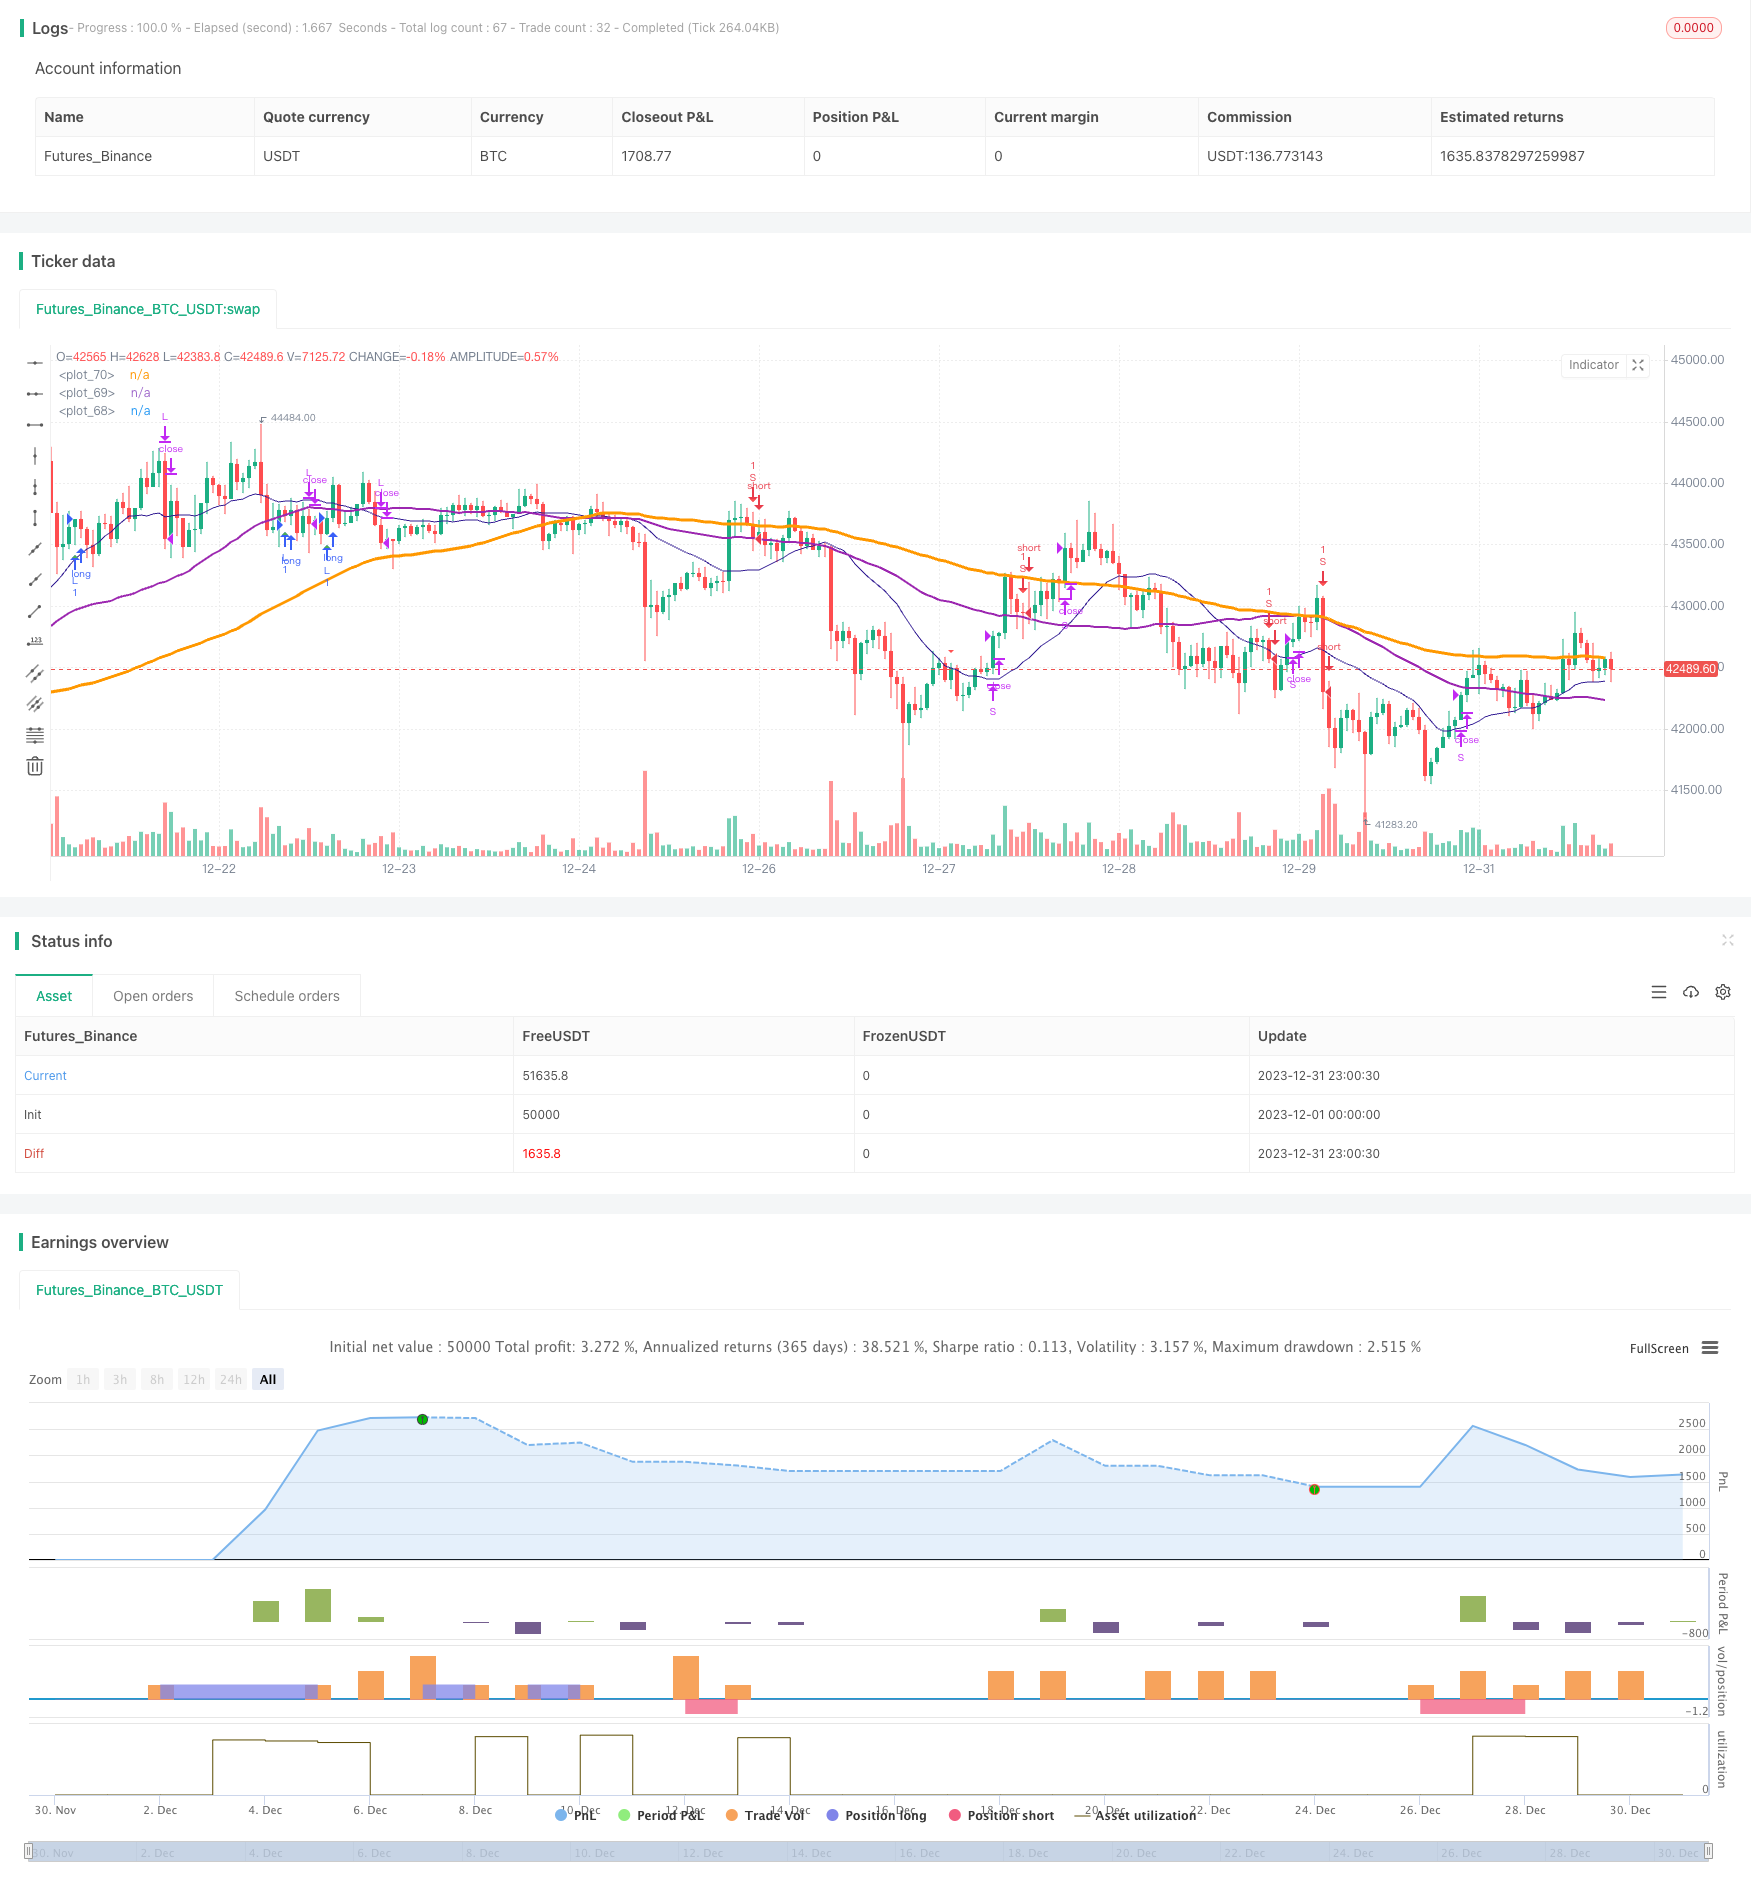
/*backtest
start: 2023-12-01 00:00:00
end: 2023-12-31 23:59:59
period: 1h
basePeriod: 15m
exchanges: [{"eid":"Futures_Binance","currency":"BTC_USDT"}]
*/

//@version=4
//study(title="@sentenzal strategy", shorttitle="@sentenzal strategy", overlay=true)
strategy(title="@sentenzal strategy", shorttitle="@sentenzal strategy", overlay=true  )
smoothK = input(3, minval=1)
smoothD = input(3, minval=1)
lengthRSI = input(14, minval=1)
lengthStoch = input(14, minval=1)
overbought = input(80, minval=1)
oversold = input(20, minval=1)
smaLengh = input(100, minval=1)
smaLengh2 = input(50, minval=1)
smaLengh3 = input(20, minval=1)

src = input(close, title="RSI Source")
testStartYear = input(2017, "Backtest Start Year")
testStartMonth = input(1, "Backtest Start Month")
testStartDay = input(1, "Backtest Start Day")
testPeriodStart = timestamp(testStartYear,testStartMonth,testStartDay,0,0)
testPeriod() =>
    time >= testPeriodStart ? true : false

rsi1 = rsi(src, lengthRSI)
k = sma(stoch(rsi1, rsi1, rsi1, lengthStoch), smoothK)
d = sma(k, smoothD)
crossBuy = crossover(k, d) and k < oversold
crossSell = crossunder(k, d) and k > overbought

dcLower = lowest(low, 10)
dcUpper = highest(high, 10)


heikinashi_close = security(heikinashi(syminfo.tickerid), timeframe.period, close)
heikinashi_open = security(heikinashi(syminfo.tickerid), timeframe.period, open)
heikinashi_low = security(heikinashi(syminfo.tickerid), timeframe.period, low)
heikinashi_high = security(heikinashi(syminfo.tickerid), timeframe.period, high)
heikinashiPositive = heikinashi_close >= heikinashi_open

heikinashiBuy = heikinashiPositive == true and heikinashiPositive[1] == false  and heikinashiPositive[2] == false
heikinashiSell = heikinashiPositive == false and heikinashiPositive[1] == true and heikinashiPositive[2] == true

//plotshape(heikinashiBuy, style=shape.arrowup, color=green, location=location.belowbar, size=size.tiny)
//plotshape(heikinashiSell, style=shape.arrowdown, color=red, location=location.abovebar, size=size.tiny)

buy = (crossBuy == true or crossBuy[1] == true or crossBuy[2] == true) and (heikinashiBuy == true or heikinashiBuy[1] == true or heikinashiBuy[2] == true)
sell = (crossSell == true or crossSell[1] == true or crossSell[2] == true) and (heikinashiSell == true or heikinashiSell[1] == true or heikinashiSell[2] == true)

mult = timeframe.period == '15' ? 4 : 1
mult2 = timeframe.period == '240' ? 0.25 : mult

movingAverage = sma(close, round(smaLengh))
movingAverage2 = sma(close, round(smaLengh2))
movingAverage3 = sma(close, round(smaLengh3))

uptrend = movingAverage < movingAverage2 and movingAverage2 < movingAverage3 and close > movingAverage
downtrend = movingAverage > movingAverage2 and movingAverage2 > movingAverage3 and close < movingAverage

signalBuy = (buy[1] == false and buy[2] == false and buy == true) and uptrend
signalSell = (sell[1] == false and sell[2] == false and sell == true) and downtrend

takeProfitSell = (buy[1] == false and buy[2] == false and buy == true) and uptrend == false
takeProfitBuy = (sell[1] == false and sell[2] == false and sell == true)  and uptrend

plotshape(signalBuy, style=shape.triangleup, color=green, location=location.belowbar, size=size.tiny)
plotshape(signalSell, style=shape.triangledown, color=red, location=location.abovebar, size=size.tiny)


plot(movingAverage, linewidth=3, color=orange, transp=0)
plot(movingAverage2, linewidth=2, color=purple, transp=0)
plot(movingAverage3, linewidth=1, color=navy, transp=0)

alertcondition(signalBuy, title='Signal Buy', message='Signal Buy')
alertcondition(signalSell, title='Signal Sell', message='Signal Sell')


strategy.close("L", when=dcLower[1] > low)
strategy.close("S", when=dcUpper[1] < high)

strategy.entry("L", strategy.long, 1, when = signalBuy and testPeriod() and uptrend)
strategy.entry("S", strategy.short, 1, when = signalSell and testPeriod() and uptrend ==false)

//strategy.exit("Exit Long", from_entry = "L", loss = 25000000, profit=25000000)
//strategy.exit("Exit Short", from_entry = "S", loss = 25000000, profit=25000000)