Strategi mengikut aliran berdasarkan DMI dan RSI
Gambaran keseluruhan
Strategi ini menggabungkan arah trend yang ditentukan oleh penunjuk DMI dan penunjuk RSI yang ditentukan oleh overbought dan oversold, untuk mencapai strategi perdagangan yang mengikuti trend yang lebih lengkap. Apabila penunjuk DMI memutuskan trend, dan penunjuk RSI menunjukkan overbought atau oversold, maka lebih banyak atau kurang.
Prinsip-prinsip strategi
- Menggunakan DMI untuk menentukan arah trend
- DMI terdiri daripada tiga kurva: + DI menunjukkan trend naik, - DI menunjukkan trend menurun, dan ADX menilai kekuatan trend
- Apabila +DI>-DI adalah trend naik, buat lebih banyak; apabila-DI>+DI adalah trend menurun, buat kosong
- Menggunakan RSI untuk menilai overbought dan oversold
- RSI menilai sama ada terlampau beli atau terlampau jual dengan membandingkan purata kenaikan dan penurunan penutupan pada satu tempoh
- RSI di bawah 30 adalah oversold, di atas 70 adalah overbought
- Menggabungkan DMI untuk menilai arah trend dan RSI untuk menilai overbought dan oversold, anda dapat lebih memahami irama pasaran
- DMI menilai terdapat trend menaik dan RSI oversold, lebih baik untuk melakukan lebih banyak masa
- DMI menilai terdapat trend menurun dan RSI overbought, untuk masa yang lebih baik untuk melakukan shorting
- Tetapkan Stop Loss Bergerak untuk Kunci Keuntungan
Analisis kelebihan
Ini adalah strategi trend-following yang lebih matang dan stabil, dengan kelebihan berikut:
- Menggabungkan penilaian trend dengan penilaian overbought dan oversold untuk mengelakkan perdagangan yang kerap dalam pasaran yang bergolak
- Menggunakan penunjuk popular DMI dan RSI, pilihan parameter mudah, praktikum mengesahkan dengan baik
- Tetapkan Hentian Bergerak untuk mengunci keuntungan dan mengelakkan Hentian Hilang
- Peraturan yang jelas dan mudah difahami, prosedur yang mudah dilaksanakan dan mudah diamalkan
Analisis risiko
Strategi ini juga mempunyai risiko yang perlu diperhatikan:
- DMI dan RSI mudah menimbulkan isyarat palsu yang boleh menyebabkan kerugian yang tidak perlu
- Pengaturan hentian bergerak yang tidak betul boleh menyebabkan hentian terlalu awal atau terlalu besar
- Tidak dapat menyaring kegawatan dengan berkesan, mudah terjebak
- Mengikuti strategi trend, tidak dapat menghentikan kerugian tepat pada masanya apabila trend berbalik
arah optimum
Strategi ini juga boleh dioptimumkan dalam beberapa aspek:
- Keadaan pergerakan bercampur dengan penapis indikator turun naik
- Penghakiman bentuk lilin untuk mengelakkan penembusan palsu
- Tetapkan pengehad kerugian yang sesuai berhampiran kedudukan rintangan sokongan utama
- Tambah model pembelajaran mesin untuk menilai trend
- Parameter untuk mengoptimumkan dinamik DMI dan RSI
Ringkasan
Strategi ini secara keseluruhan adalah strategi mengikuti trend yang lebih stabil dan praktikal, dengan menilai arah trend melalui DMI, RSI menilai overbought dan oversold, sehingga merebut peluang perdagangan di garis tengah. Pada masa yang sama, menetapkan hentian bergerak untuk mengunci keuntungan. Pilihan parameter strategi ini mudah, peraturan perdagangan jelas, mudah untuk dipraktikkan.
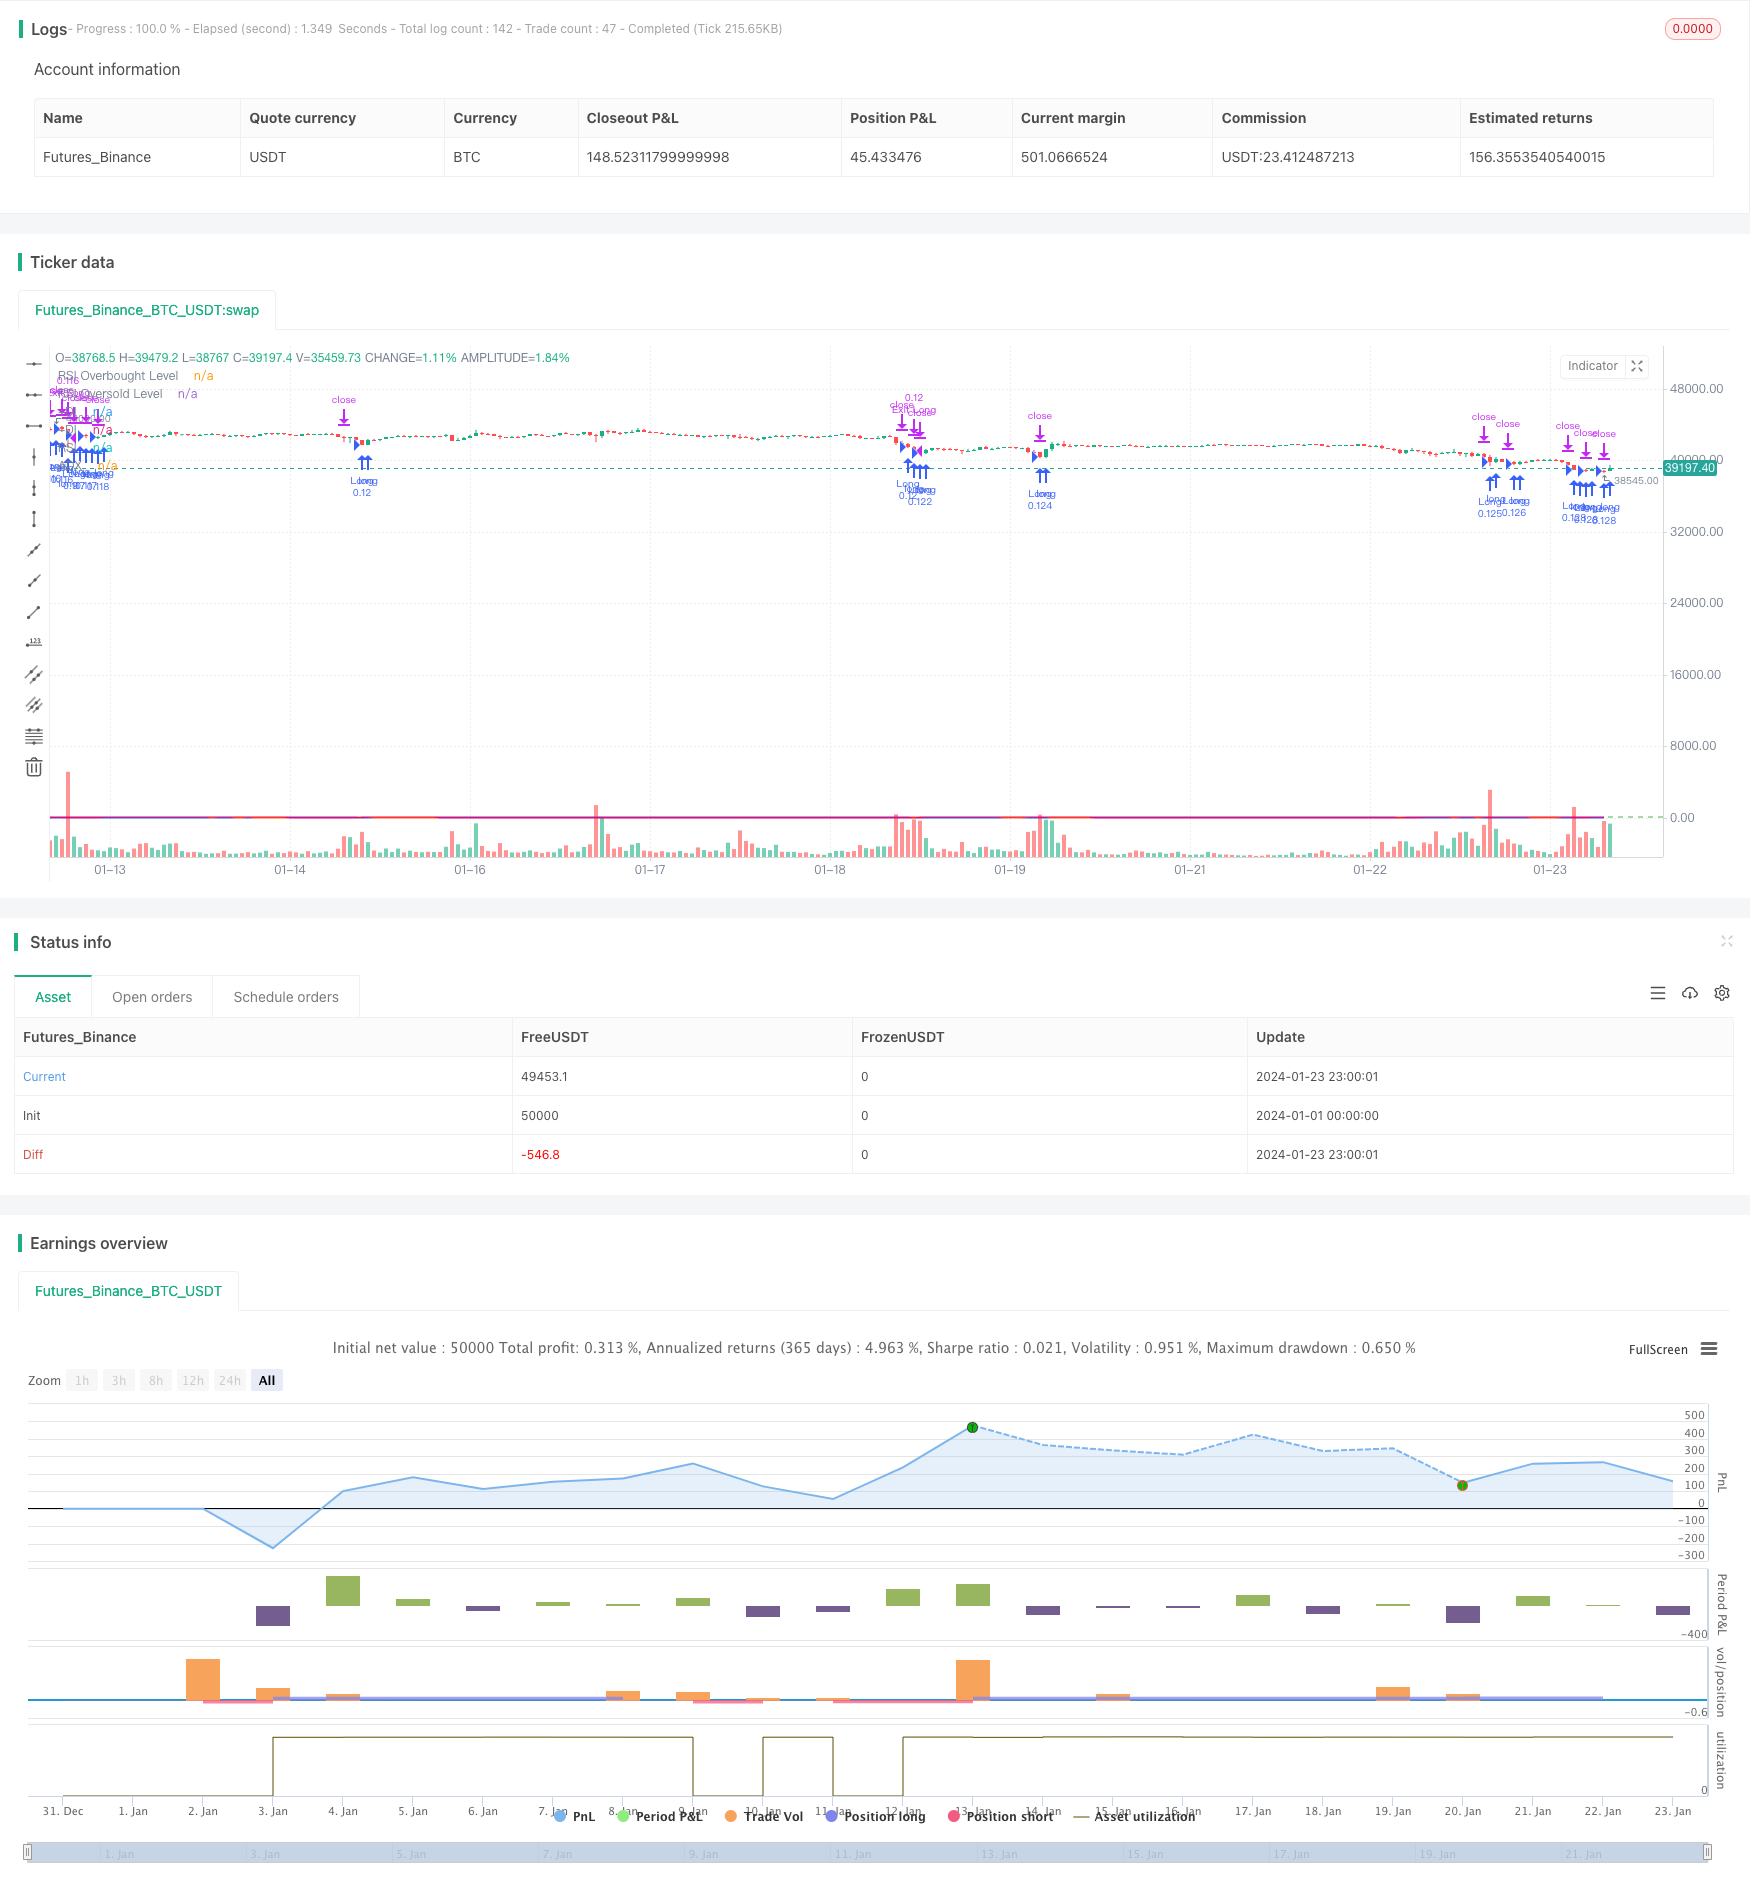
/*backtest
start: 2024-01-01 00:00:00
end: 2024-01-24 00:00:00
period: 1h
basePeriod: 15m
exchanges: [{"eid":"Futures_Binance","currency":"BTC_USDT"}]
*/

// This Pine Script™ code is subject to the terms of the Mozilla Public License 2.0 at https://mozilla.org/MPL/2.0/
// © YingYangJPN

//@version=5
strategy("DMI and RSI Strategy", overlay=true, initial_capital=10000, default_qty_type=strategy.percent_of_equity, default_qty_value=10)

// DMI indikatörünü tanımlayalım
lensig = input.int(14, title="ADX Smoothing", minval=1, maxval=50)
len = input.int(14, minval=1, title="DI Length")
up = ta.change(high)
down = -ta.change(low)
plusDM = na(up) ? na : (up > down and up > 0 ? up : 0)
minusDM = na(down) ? na : (down > up and down > 0 ? down : 0)
trur = ta.rma(ta.tr, len)
plus = fixnan(100 * ta.rma(plusDM, len) / trur)
minus = fixnan(100 * ta.rma(minusDM, len) / trur)
sum = plus + minus
adx = 100 * ta.rma(math.abs(plus - minus) / (sum == 0 ? 1 : sum), lensig)
trailing_stop_loss_factor = input.float(0.50, "Trailing Stop Loss Factor", step = 0.01)

// RSI indikatörünü tanımlayalım
rsiLength = input.int(14, minval=1, title="RSI Length")
rsiSource = input(close, title="RSI Source")
rsiOverbought = input.int(70, title="RSI Overbought Level")
rsiOversold = input.int(30, title="RSI Oversold Level")
rsiValue = ta.rsi(rsiSource, rsiLength)

// Uzun pozisyon açma koşullarını tanımlayalım
longCondition1 = rsiValue < rsiOversold // RSI oversold seviyesinin altındaysa
longCondition2 = adx > 20 // ADX 20'den büyükse
longCondition3 = minus > plus

// Kısa pozisyon açma koşullarını tanımlayalım
shortCondition1 = rsiValue > rsiOverbought // RSI overbought seviyesinin üstündeyse
shortCondition2 = adx > 20 // ADX 20'den büyükse
shortCondition3 = plus > minus

// Uzun pozisyon açalım
if longCondition1 and longCondition2 and longCondition3
    strategy.entry("Long", strategy.long)


// Kısa pozisyon açalım
if shortCondition1 and shortCondition2 and shortCondition3
    strategy.entry("Short", strategy.short)

// Trailing Stop Loss
longTrailingStopLoss = strategy.position_avg_price * (1 - trailing_stop_loss_factor / 100)
shortTrailingStopLoss = strategy.position_avg_price * (1 + trailing_stop_loss_factor / 100)
if strategy.position_size > 0
    strategy.exit("Exit Long", "Long", stop  = longTrailingStopLoss)
if strategy.position_size < 0
    strategy.exit("Exit Short", "Short", stop = shortTrailingStopLoss)

// DMI ve RSI indikatörlerini grafiğe çizelim
plot(adx, color=#F50057, title="ADX")
plot(plus, color=#2962FF, title="+DI")
plot(minus, color=#FF6D00, title="-DI")
plot(rsiValue, color=#9C27B0, title="RSI")
hline(rsiOverbought, title="RSI Overbought Level", color=#E91E63, linestyle=hline.style_dashed)
hline(rsiOversold, title="RSI Oversold Level", color=#4CAF50, linestyle=hline.style_dashed)