Penunjuk asas dua strategi berikut
Gambaran keseluruhan
Strategi pengesanan indeks dua asas adalah strategi perdagangan kuantitatif mata wang digital. Strategi ini menghasilkan isyarat perdagangan dengan menggabungkan isyarat dua indeks asas, iaitu 123 Reverse Index dan Qstick Index, dan membuat keputusan masuk berdasarkan keserasian kedua-dua indeks.
Prinsip Strategi
Strategi ini terdiri daripada dua bahagian:
- 123 penunjuk kebalikan
Isyarat dagangan untuk penunjuk ini berasal dari harga penutupan dua baris terakhir K. Isyarat dagangan dihasilkan jika harga penutupan dua baris terakhir K berbalik (iaitu, harga penutupan beralih dari naik ke turun atau dari turun ke naik) dan pada masa yang sama memenuhi syarat penunjuk rawak.
Secara khusus, jika harga penutupan dua hari sebelumnya jatuh, harga penutupan hari ini meningkat, dan pada hari ke-9 garis perlahan rawak di bawah 50, menghasilkan isyarat beli; jika harga penutupan dua hari sebelumnya meningkat, harga penutupan hari ini jatuh, dan pada hari ke-9 garis pantas rawak di atas 50, menghasilkan isyarat jual.
- Penunjuk Qstick
Penunjuk ini menilai kekuatan multihead dan kosong dengan mengira purata bergerak sederhana perbezaan antara harga pembukaan dan harga penutupan. Ia menghasilkan isyarat perdagangan melalui perjalanannya melalui sumbu sifar.
Jika Qstick di atas melalui paksi sifar, menunjukkan peningkatan kekuatan multihead, menghasilkan isyarat beli; jika Qstick di bawah melalui paksi sifar, menunjukkan peningkatan kekuatan kosong, menghasilkan isyarat menjual.
Indeks dua asas mengikuti strategi yang mempertimbangkan secara menyeluruh isyarat perdagangan 123 reversal dan Qstick, dan mengambil tindakan perdagangan yang sesuai apabila kedua-dua isyarat sesuai.
Analisis kelebihan
Penunjuk dua asas mengikuti strategi yang menggabungkan isyarat dua jenis penunjuk yang berbeza, yang dapat meningkatkan ketepatan isyarat perdagangan. Dibandingkan dengan penunjuk tunggal, ia dapat mengurangkan isyarat yang salah dan memperoleh kadar kemenangan yang lebih tinggi.
Selain itu, strategi ini hanya boleh digunakan apabila kedua-dua isyarat penunjuk adalah sama, yang dapat mengawal risiko dengan berkesan dan mencegah perbezaan dua asas.
Risiko dan Penyelesaian
- Sinyal penunjuk menghasilkan masa yang berbeza, tidak dapat digabungkan dengan sempurna
Anda boleh mengoptimumkan parameter untuk menyesuaikan parameter kedua-dua penunjuk supaya frekuensi dan irama yang dihasilkan oleh isyarat mereka lebih selaras.
- Perbezaan dua asas sering menyebabkan sambungan yang terlalu pendek
Anda boleh menetapkan tempoh pemegangan minimum untuk mengelakkan penarikan dan penubuhan mandat yang kerap.
Arah pengoptimuman
Optimumkan parameter panjang kedua-dua indikator untuk mencari kombinasi parameter terbaik
Uji konfigurasi parameter penunjuk rawak yang berbeza
Ikut strategi henti kerugian
ringkaskan
Indeks dua asas mengikuti strategi dengan menggabungkan kelebihan beberapa indikator asas, yang dapat meningkatkan kualiti isyarat dan memperoleh keuntungan yang lebih tinggi sambil mengawal risiko. Strategi ini mempunyai ruang untuk pengoptimuman parameter dan pengoptimuman strategi lebih lanjut, dan dengan ujian dapat menjadikan strategi lebih stabil dan boleh dipercayai.
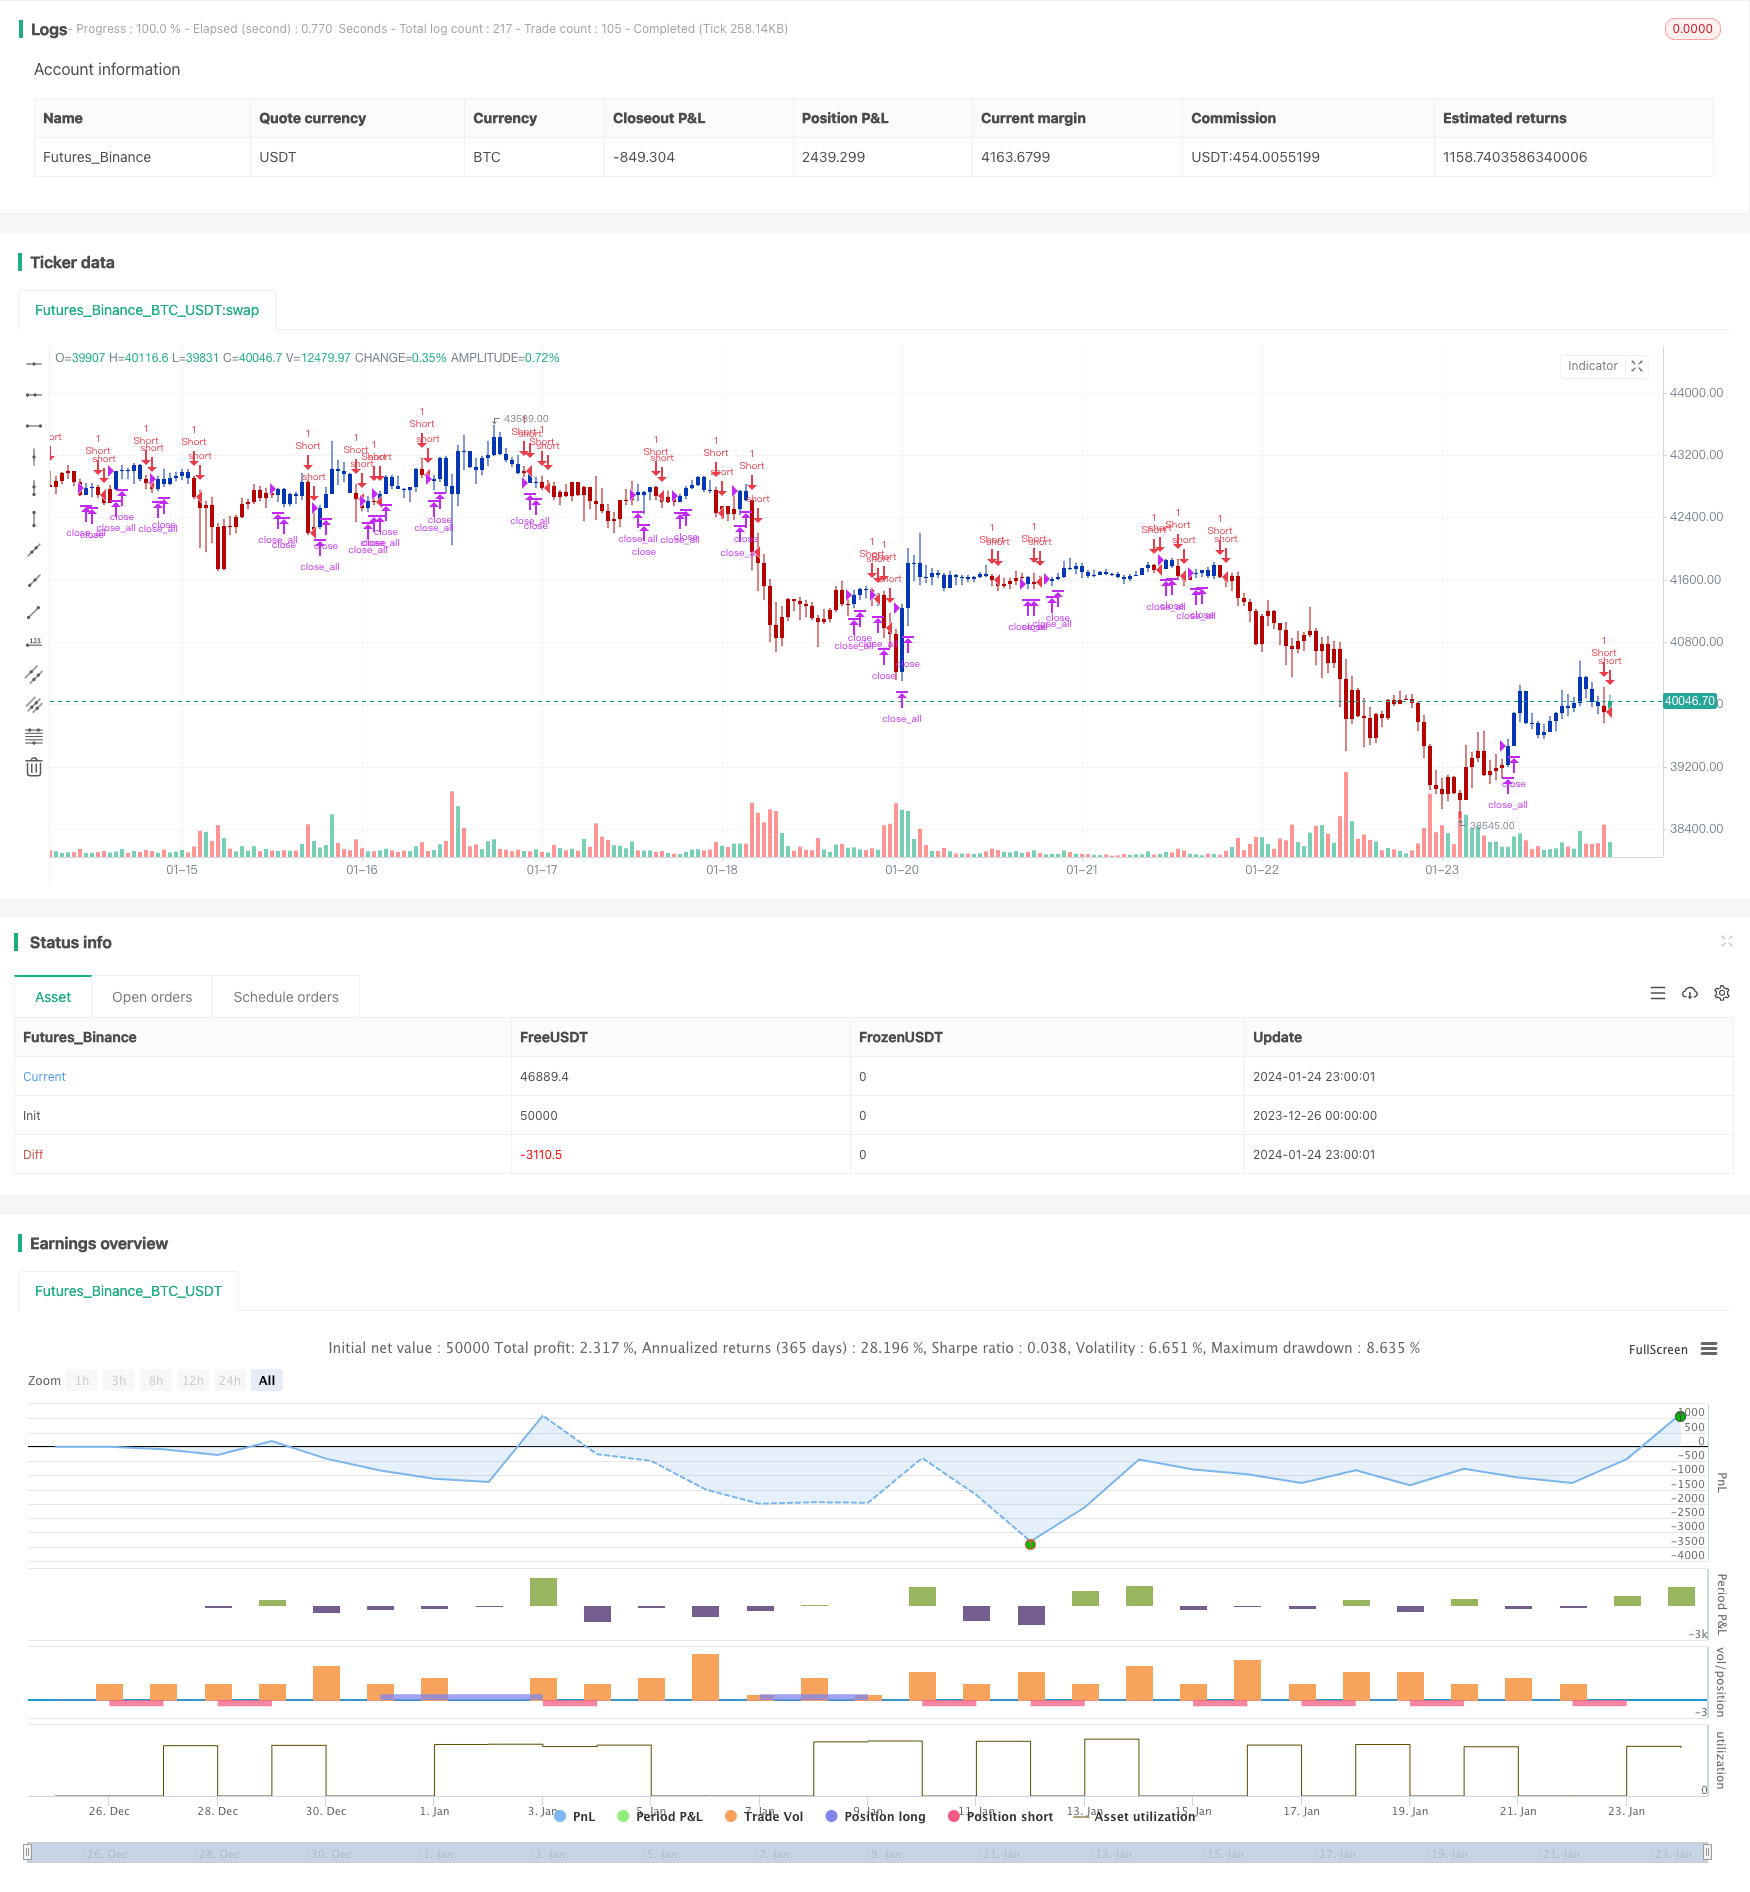
/*backtest
start: 2023-12-26 00:00:00
end: 2024-01-25 00:00:00
period: 1h
basePeriod: 15m
exchanges: [{"eid":"Futures_Binance","currency":"BTC_USDT"}]
*/

//@version=4
////////////////////////////////////////////////////////////
//  Copyright by HPotter v1.0 24/05/2021
// This is combo strategies for get a cumulative signal.
//
// First strategy
// This System was created from the Book "How I Tripled My Money In The
// Futures Market" by Ulf Jensen, Page 183. This is reverse type of strategies.
// The strategy buys at market, if close price is higher than the previous close
// during 2 days and the meaning of 9-days Stochastic Slow Oscillator is lower than 50.
// The strategy sells at market, if close price is lower than the previous close price
// during 2 days and the meaning of 9-days Stochastic Fast Oscillator is higher than 50.
//
// Second strategy
// A technical indicator developed by Tushar Chande to numerically identify
// trends in candlestick charting. It is calculated by taking an 'n' period
// moving average of the difference between the open and closing prices. A
// Qstick value greater than zero means that the majority of the last 'n' days
// have been up, indicating that buying pressure has been increasing.
// Transaction signals come from when the Qstick indicator crosses through the
// zero line. Crossing above zero is used as the entry signal because it is indicating
// that buying pressure is increasing, while sell signals come from the indicator
// crossing down through zero. In addition, an 'n' period moving average of the Qstick
// values can be drawn to act as a signal line. Transaction signals are then generated
// when the Qstick value crosses through the trigger line.
//
// WARNING:
// - For purpose educate only
// - This script to change bars colors.
////////////////////////////////////////////////////////////
Reversal123(Length, KSmoothing, DLength, Level) =>
    vFast = sma(stoch(close, high, low, Length), KSmoothing)
    vSlow = sma(vFast, DLength)
    pos = 0.0
    pos := iff(close[2] < close[1] and close > close[1] and vFast < vSlow and vFast > Level, 1,
	         iff(close[2] > close[1] and close < close[1] and vFast > vSlow and vFast < Level, -1, nz(pos[1], 0)))
	pos


Qstick(Length) =>
    pos = 0.0
    xR = close - open
    xQstick = sma(xR, Length)
    pos:= iff(xQstick > 0, 1,
           iff(xQstick < 0, -1, nz(pos[1], 0)))
    pos

strategy(title="Combo Backtest 123 Reversal & Qstick Indicator", shorttitle="Combo", overlay = true)
line1 = input(true, "---- 123 Reversal ----")
Length = input(14, minval=1)
KSmoothing = input(1, minval=1)
DLength = input(3, minval=1)
Level = input(50, minval=1)
//-------------------------
line2 = input(true, "---- Qstick Indicator ----")
LengthQ = input(14, minval=1)
reverse = input(false, title="Trade reverse")
posReversal123 = Reversal123(Length, KSmoothing, DLength, Level)
posQstick = Qstick(LengthQ)
pos = iff(posReversal123 == 1 and posQstick == 1 , 1,
	   iff(posReversal123 == -1 and posQstick == -1, -1, 0))
possig = iff(reverse and pos == 1, -1,
          iff(reverse and pos == -1 , 1, pos))
if (possig == 1 )
    strategy.entry("Long", strategy.long)
if (possig == -1 )
    strategy.entry("Short", strategy.short)
if (possig == 0)
    strategy.close_all()
barcolor(possig == -1 ? #b50404: possig == 1 ? #079605 : #0536b3 )