Strategi perdagangan kuantitatif menggunakan pelbagai penunjuk teknikal
Gambaran keseluruhan
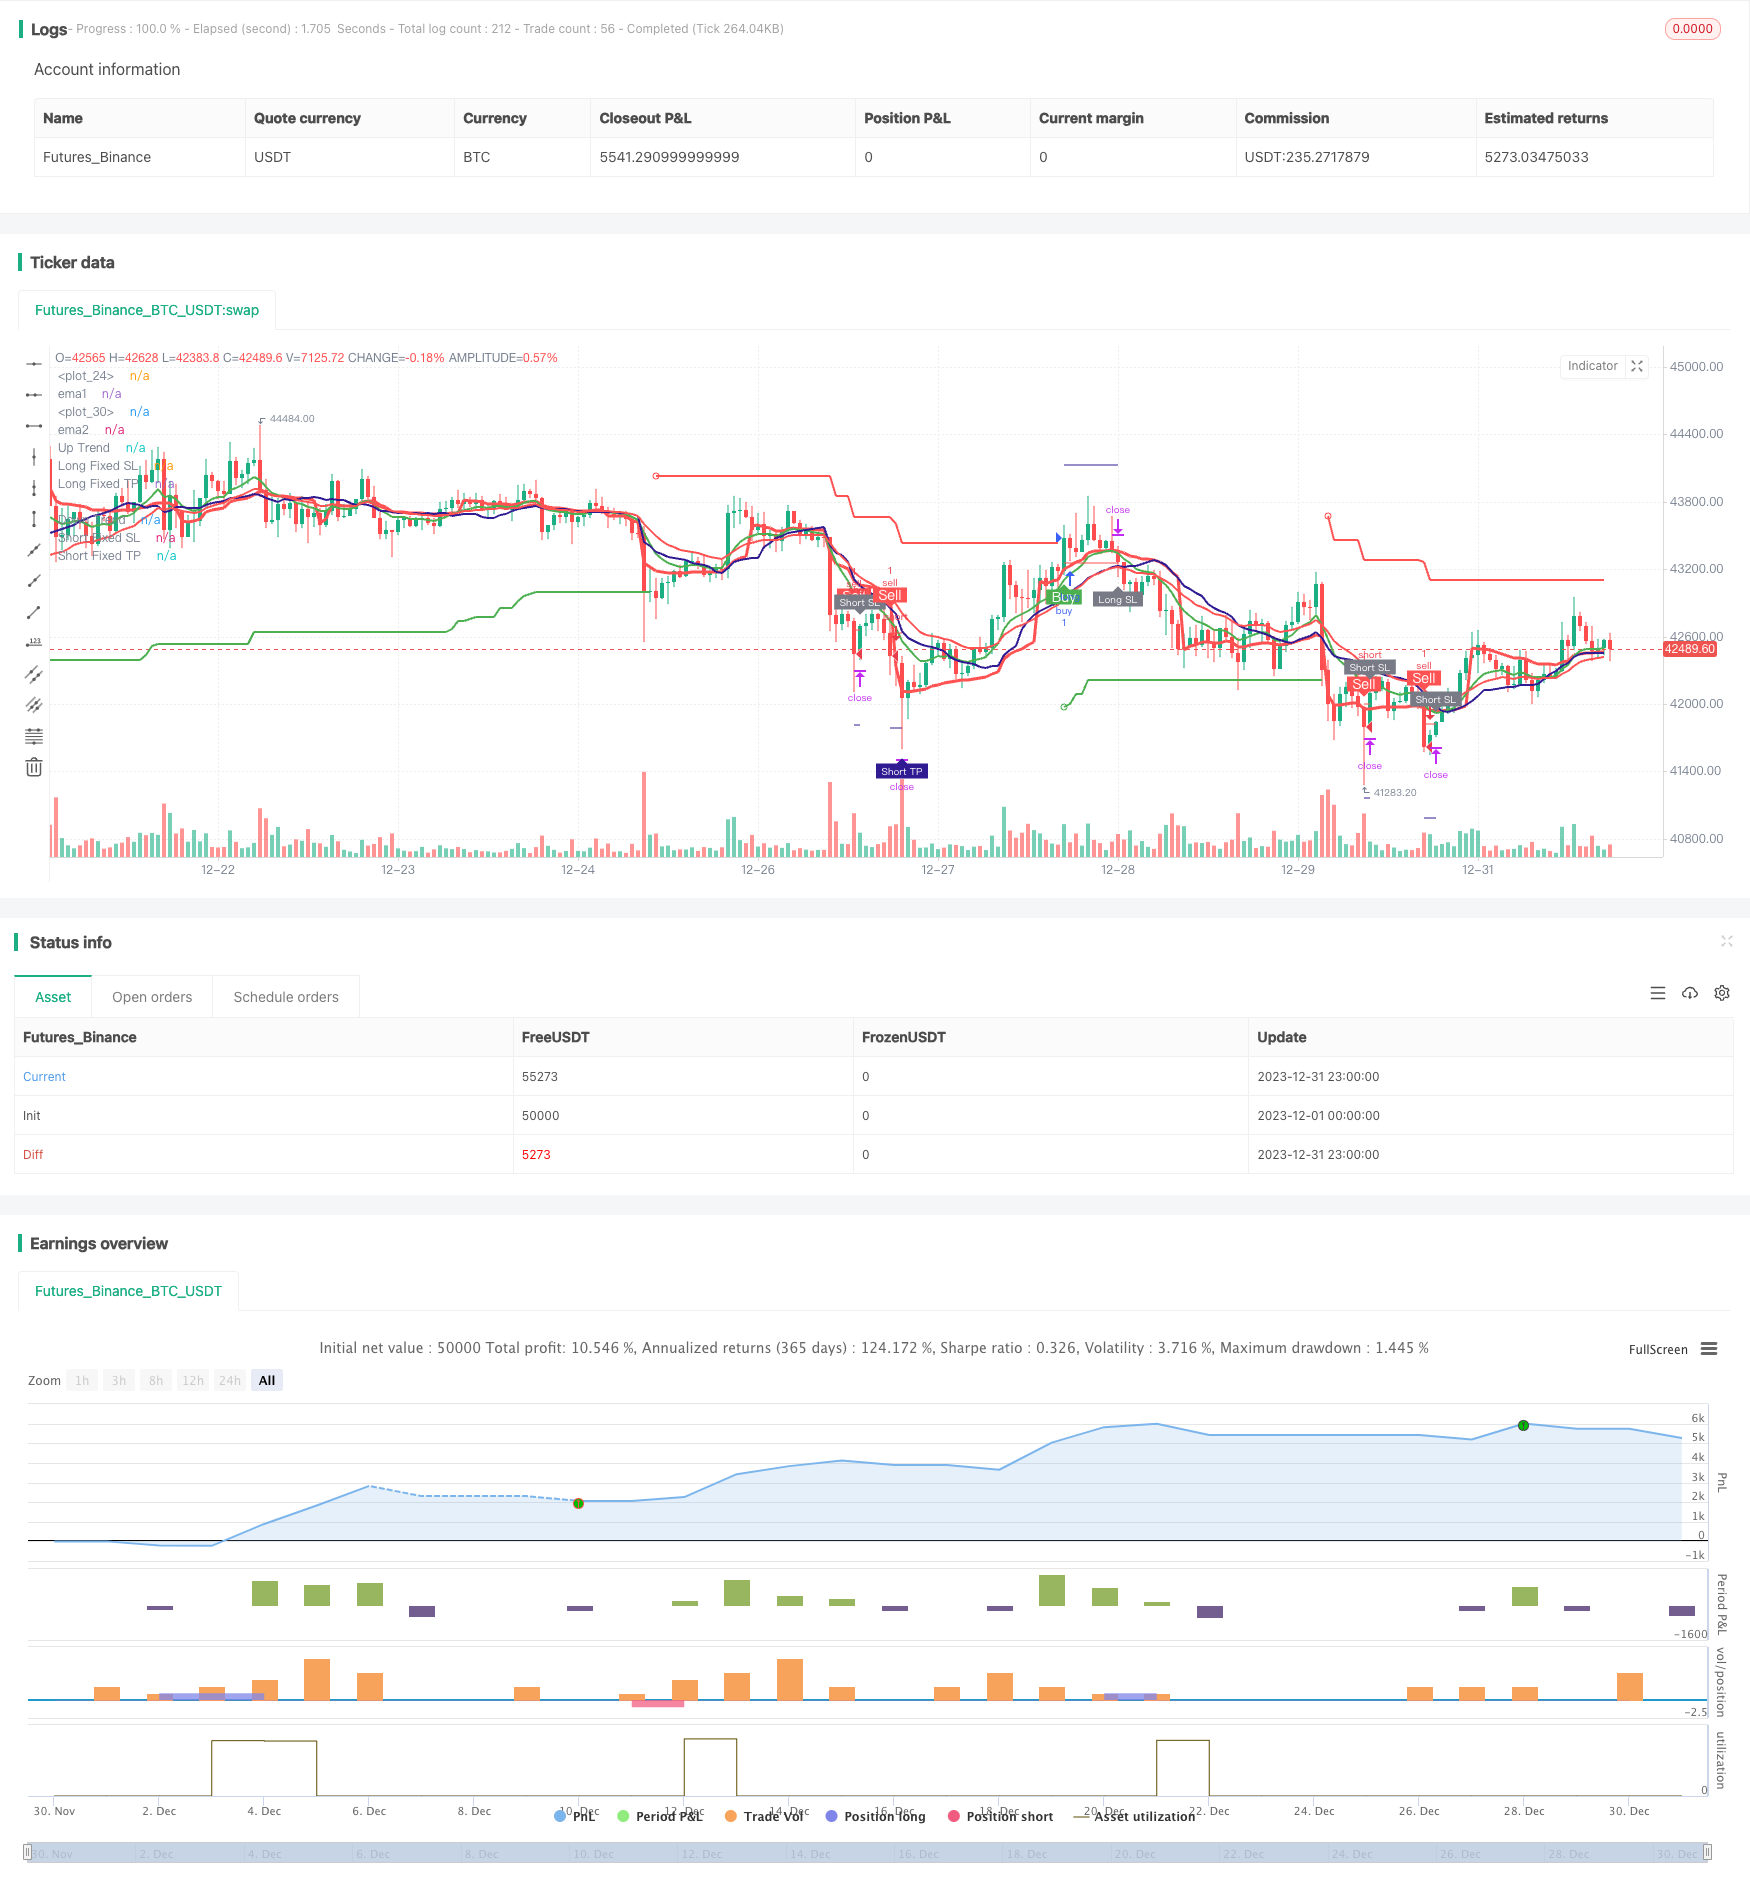
Strategi ini adalah strategi yang menggunakan pelbagai petunjuk teknikal untuk melakukan perdagangan kuantitatif. Ia menggunakan pelbagai petunjuk seperti EMA, SuperTrend, RSI, MACD dan lain-lain untuk membentuk isyarat perdagangan.
Prinsip Strategi
Logik perdagangan utama strategi ini adalah berdasarkan aspek berikut:
EMA persilangan rata-rata: Hitung EMA1 dan EMA2 garis laju, yang menghasilkan isyarat beli apabila ia melintasi garis laju, dan isyarat jual apabila ia melintasi garis laju.
Garis rata VWMA: Mengira Garis rata VWMA, apabila harga penutupan melintasi garisan rata-rata dianggap sebagai isyarat membeli, apabila ia melintasi garisan rata-rata dianggap sebagai isyarat menjual.
Indikator SuperTrend: Mengira naik dan turun SuperTrend berdasarkan ATR dan parameter pengganda, dan menentukan arah trend. Menghasilkan isyarat beli dalam trend menaik, menghasilkan isyarat jual dalam trend menurun.
RSI: Untuk mengira RSI, RSI di atas garis beli dianggap sebagai isyarat jual, dan RSI di bawah kawasan jual dianggap sebagai isyarat beli.
Indikator MACD: Mengira garis laju, garis perlahan dan garis isyarat MACD, yang menghasilkan isyarat beli ketika melintasi garis isyarat di atas garis cepat, dan menghasilkan isyarat jual ketika melintasi garis isyarat di bawah garis pantas.
Setelah mendapat isyarat perdagangan untuk beberapa petunjuk di atas, strategi menggunakan logik AND AND, iaitu menghasilkan isyarat beli dan jual akhir apabila beberapa petunjuk mengeluarkan isyarat pada masa yang sama.
Kelebihan Strategik
Strategi ini mengintegrasikan pelbagai petunjuk untuk menilai pasaran, yang dapat mengurangkan isyarat palsu. Kelebihan utama termasuk:
Menggunakan pelbagai penunjuk untuk penapisan komposit dapat mengurangkan isyarat salah yang disebabkan oleh satu penunjuk.
Gabungan indikator trend dan indikator gegaran boleh menghasilkan keuntungan tambahan dalam keadaan trend.
Dengan logik stop loss yang sempurna, kerugian maksimum dalam satu transaksi dapat dikawal dengan berkesan.
Logik ganda membuat kerugian dan peluang untuk mendapatkan kembali dengan menambah kedudukan.
Risiko Strategik
Strategi ini mempunyai risiko utama:
Portfolio pelbagai petunjuk mungkin terlalu konservatif dan kehilangan beberapa peluang perdagangan. Portfolio petunjuk boleh disederhanakan dengan sewajarnya.
Logik kenaikan saham ganda boleh menyebabkan kerugian meningkat. Sepatutnya sekatan jumlah kenaikan saham ditetapkan dengan munasabah.
Penetapan kedudukan hentian yang tidak betul boleh menyebabkan hentian yang tidak perlu. Kedudukan hentian yang disesuaikan harus disesuaikan.
Tetapan parameter penunjuk yang tidak betul boleh menyebabkan terlalu banyak isyarat salah. Parameter harus dioptimumkan untuk mendapatkan kombinasi parameter yang terbaik.
Arah pengoptimuman strategi
Strategi ini boleh dioptimumkan dengan cara berikut:
Menilai kesan gabungan parameter yang berbeza, pilih berat indikator.
Uji seting parameter penunjuk yang berbeza.
Tambah logik penangguhan kerosakan.
Bergabung dengan mekanisme pengurusan kedudukan dinamik.
Menggunakan kaedah pembelajaran mesin untuk mengoptimumkan parameter dan model.
ringkaskan
Strategi ini secara keseluruhan adalah strategi perdagangan kuantitatif yang sangat praktikal. Ia menggabungkan kelebihan pelbagai petunjuk teknikal klasik untuk membuat penilaian pasaran yang berkesan. Dengan pengoptimuman parameter dan iterasi model, strategi ini dapat memperoleh kesan perdagangan yang lebih baik.
/*backtest
start: 2023-12-01 00:00:00
end: 2023-12-31 23:59:59
period: 1h
basePeriod: 15m
exchanges: [{"eid":"Futures_Binance","currency":"BTC_USDT"}]
*/


//@version=5
strategy(title='Pinku Buy', overlay=true)

fromMonth = input.int(defval=1, title='From Month', minval=1, maxval=12)
fromDay = input.int(defval=1, title='From Day', minval=1, maxval=31)
fromYear = input.int(defval=2021, title='From Year', minval=1970)
thruMonth = input.int(defval=1, title='Thru Month', minval=1, maxval=12)
thruDay = input.int(defval=1, title='Thru Day', minval=1, maxval=31)
thruYear = input.int(defval=2112, title='Thru Year', minval=1970)

showDate = input(defval=true, title='Show Date Range')

start = timestamp(fromYear, fromMonth, fromDay, 00, 00)
finish = timestamp(thruYear, thruMonth, thruDay, 23, 59)
window() => true
// ema crossover
length1 = input.int(10)
length2 = input.int(20)
ema1 = ta.ema(close , length1)
ema2 = ta.ema(close , length2)
//vwap
VWAP = ta.vwap(hlc3)
plot(VWAP, color=color.new(color.red, 0), linewidth=3)
buy_1 = close > VWAP
sell_1 = close < VWAP
//vwma
len = input.int(20, 'VWMA_len', minval=1)
ma = ta.vwma(close, len)
plot(ma, color=color.new(color.navy, 0), linewidth=2)
buy_2 = close > ma
sell_2 = close < ma
//super trend
//inputs
Periods = input(title='STR Period', defval=22)
Source = input(hl2, title='Source')
Multiplier = input.float(title='STR Multiplier', step=0.1, defval=5.0)


//Compute ATR Levels
atr = ta.atr(Periods)


//Creating Upper Channel

up = Source - Multiplier * atr
up1 = nz(up[1], up)
up := close[1] > up1 ? math.max(up, up1) : up

//Creating Down Channel
dn = Source + Multiplier * atr
dn1 = nz(dn[1], dn)
dn := close[1] < dn1 ? math.min(dn, dn1) : dn


//Compute the Trend Stream +1/-1
trend = 1
trend := nz(trend[1], trend)
trend := trend == -1 and close > dn1 ? 1 : trend == 1 and close < up1 ? -1 : trend

//Create Stoploss for Longs
upPlot = plot(trend == 1 ? up : na, title='Up Trend', style=plot.style_linebr, linewidth=2, color=color.new(color.green, 0))
//buy_a = close > upPlot
//Buy Signal
buy_3 = trend == 1 and trend[1] == -1

plotshape(buy_3 ? up : na, title='Go Long', location=location.absolute, style=shape.circle, size=size.tiny, color=color.new(color.green, 0))

dnPlot = plot(trend == 1 ? na : dn, title='Down Trend', style=plot.style_linebr, linewidth=2, color=color.new(color.red, 0))
//sell_a = close < dnPlot
//Sell Signal
sell_3 = trend == -1 and trend[1] == 1

plotshape(sell_3 ? dn : na, title='Go Short', location=location.absolute, style=shape.circle, size=size.tiny, color=color.new(color.red, 0))
// //paraboloic sar
// start = input(0.02)
// increment = input(0.02)
// maximum = input(0.2, 'Max Value')
// out = ta.sar(start, increment, maximum)


buy_4 = ema1 > ema2
//buy_4 = buy1 and not buy1[1]
//plotshape(buy_4 , color = color.green , text = "Buy" , location = location.belowbar , textcolor = color.white , style = shape.labelup , size = size.small)
sell_4 = close < ema2
//sell_4 = sell1 and not sell1[1]
//plotshape(sell_4, color = color.red , text = "Sell" , location = location.abovebar , textcolor = color.white , style = shape.labeldown , size = size.small)
plot(ema1, 'ema1', color=color.new(color.green, 0), linewidth=2)
plot(ema2, 'ema2', color=color.new(color.red, 0), linewidth=2)

// rsi
lenr = input(14, title='Rsi Period')
rs = ta.rsi(close, lenr)

over_sold = input(44)
over_bought = input(56)

buy_5 = rs > over_bought
sell_5 = rs < over_sold
// macd
slow_len_macd = input.int(12)
fast_len_macd = input.int(26)
signal_len_macd = input.int(9)

ema3 = ta.ema(close , slow_len_macd)
ema4 = ta.ema(close , fast_len_macd)
ema5 = ta.ema(close , signal_len_macd)

buy_6 = ema5 > ema4
sell_6 = ema5 < ema4

// adx
adxlen = input(14, title="ADX Smoothing")
dilen = input(14, title="DI Length")
dirmov(len) =>
	up = ta.change(high)
	down = -ta.change(low)
	plusDM = na(up) ? na : (up > down and up > 0 ? up : 0)
	minusDM = na(down) ? na : (down > up and down > 0 ? down : 0)
	truerange = ta.rma(ta.tr, len)
	plus = fixnan(100 * ta.rma(plusDM, len) / truerange)
	minus = fixnan(100 * ta.rma(minusDM, len) / truerange)
	[plus, minus]
adx(dilen, adxlen) =>
	[plus, minus] = dirmov(dilen)
	sum = plus + minus
	adx = 100 * ta.rma(math.abs(plus - minus) / (sum == 0 ? 1 : sum), adxlen)
sig = adx(dilen, adxlen)
//plot(sig, color=color.red, title="ADX")
adx_Greater_than = input.int(25)

signal = sig > adx_Greater_than
// volume ema
volume_ema = input.int(10)

vema = ta.ema(volume,volume_ema)

signal_2 = volume > vema


//define buy sell
g = buy_1 and buy_2 and buy_4 and trend == 1 and buy_5 and buy_6 and signal and signal_2 and window()
r = sell_1 and sell_2 and sell_4 and trend == -1 and sell_5 and sell_6 and signal and signal_2 and window()

rg = 0
rg := r ? 1 : g ? 2 : nz(rg[1])

buy11 = 0
buy11 := r ? 0 : g ? 1 : nz(buy11[1])
sell11 = 0
sell11 := r ? 1 : g ? 0 : nz(sell11[1])

buy = buy11 and not buy11[1]
sell = sell11 and not sell11[1]
multiple_signals = input(true)

if multiple_signals
    buy := g and not g[1] and  window()
    sell := r and not r[1] and  window()
    sell
else
    buy := buy and window()
    sell := sell and window()
    sell


//plotshape(long  , color = color.green , text = "Buy" , location = location.belowbar , textcolor = color.white , style = shape.labelup , size = size.small)
//plotshape(short   , color = color.red , text = "Sell" , location = location.abovebar , textcolor = color.white , style = shape.labeldown , size = size.small)
Stop = input(0.5, title='StopLoss') / 100

ProfitPerc = input(defval=1.5, title='Profit') / 100

rev = input(1024,title = "Reverse Limit")

Averaging_position_ = input(true , title = "Averaging position ? ")

qn = 1
qn := nz(qn[1])


long_short = 0
long_last = buy and (nz(long_short[1]) == 0 or nz(long_short[1]) == -1)
short_last = sell and (nz(long_short[1]) == 0 or nz(long_short[1]) == 1)
long_short := long_last ? 1 : short_last ? -1 : long_short[1]

long_entered = false
long_entered := long_entered[1]

short_entered = false
short_entered := short_entered[1]


longPrice = ta.valuewhen(long_last, close, 0)
shortPrice = ta.valuewhen(short_last, close, 0)


longStop = longPrice * (1 - Stop)
shortStop = shortPrice * (1 + Stop)
longTake = longPrice * (1 + ProfitPerc)
shortTake = shortPrice * (1 - ProfitPerc)
plot(long_short == 1 ? longStop : na, style=plot.style_linebr, color=color.new(color.red, 0), linewidth=1, title='Long Fixed SL')
plot(long_short == -1 ? shortStop : na, style=plot.style_linebr, color=color.new(color.red, 0), linewidth=1, title='Short Fixed SL')
plot(long_short == 1 ? longTake : na, style=plot.style_linebr, color=color.new(color.navy, 0), linewidth=1, title='Long Fixed TP')


plot(long_short == -1 ? shortTake : na, style=plot.style_linebr, color=color.new(color.navy, 0), linewidth=1, title='Short Fixed TP')


longBar1 = ta.barssince(long_last)
longBar2 = longBar1 >= 1 ? true : false
shortBar1 = ta.barssince(short_last)
shortBar2 = shortBar1 >= 1 ? true : false

longSLhit = long_short == 1 and longBar2 and low < longStop

if long_entered and sell
    longSLhit := true
    longSLhit

plotshape(longSLhit and not(sell and not short_entered and long_entered), style=shape.labelup, location=location.belowbar, color=color.new(color.gray, 0), size=size.tiny, title='Stop Loss', text='Long SL', textcolor=color.new(color.white, 0))
shortSLhit = long_short == -1 and shortBar2 and high > shortStop


if short_entered and buy
    shortSLhit := true
    shortSLhit

plotshape(shortSLhit and not(buy and not long_entered and short_entered), style=shape.labeldown, location=location.abovebar, color=color.new(color.gray, 0), size=size.tiny, title='Stop Loss', text='Short SL', textcolor=color.new(color.white, 0))


longTPhit = long_short == 1 and longBar2 and high > longTake
plotshape(longTPhit, style=shape.labeldown, location=location.abovebar, color=color.new(color.navy, 0), size=size.tiny, title='Target', text='Long TP', textcolor=color.new(color.white, 0))
shortTPhit = long_short == -1 and shortBar2 and low < shortTake
plotshape(shortTPhit, style=shape.labelup, location=location.belowbar, color=color.new(color.navy, 0), size=size.tiny, title='Target', text='Short TP', textcolor=color.new(color.white, 0))

long_short := (long_short == 1 or long_short == 0) and longBar2 and (longSLhit or longTPhit) ? 0 : (long_short == -1 or long_short == 0) and shortBar2 and (shortSLhit or shortTPhit) ? 0 : long_short

if(shortSLhit or longSLhit or (long_entered[1] and sell) or (short_entered[1] and buy ))
    qn := qn*2

if(longTPhit or shortTPhit or qn > rev)
    qn := 1

if Averaging_position_
    qn := 1

plotshape(buy and not long_entered, color=color.new(color.green, 0), style=shape.labelup, text='Buy', textcolor=color.new(color.white, 0), location=location.belowbar)
plotshape(sell and not short_entered, color=color.new(color.red, 0), style=shape.labeldown, text='Sell', textcolor=color.new(color.white, 0), location=location.abovebar)


// plotshape(buy and not(long_entered) and (short_entered), color = color.green , style = shape.labelup , text = "FA Buy" , textcolor = color.white , location = location.belowbar)
// plotshape(sell and not(short_entered)  and (long_entered), color = color.red , style = shape.labeldown , text = "FA Sell" , textcolor = color.white , location = location.abovebar)


// alertcondition(condition=buy and  not(long_entered)  and (short_entered), title="Fully Algo Buy")
// alertcondition(condition=sell and  not(short_entered)  and (long_entered), title="Fully Algo sell")

alertcondition(condition=buy and not long_entered, title='Buy')
alertcondition(condition=sell and not short_entered, title='Sell')

if long_last
    long_entered := true
    short_entered := false
    short_entered
if short_last
    short_entered := true
    long_entered := false
    long_entered

alertcondition(condition=longSLhit and not(sell and not short_entered and long_entered), title='Long SL')
alertcondition(condition=shortSLhit and not(buy and not long_entered and short_entered), title='Short SL')

alertcondition(condition=longTPhit, title='Long TP')
alertcondition(condition=shortTPhit, title='Short TP')

if longSLhit or longTPhit
    long_entered := false
    long_entered

if shortSLhit or shortTPhit
    short_entered := false
    short_entered

// if buy
//     strategy.entry('buy', strategy.long)
//     strategy.exit('exit', 'buy', limit=longTake, stop=longStop)


// if sell
//     strategy.entry('sell', strategy.short)
//     strategy.exit('exit', 'sell', limit=shortTake, stop=shortStop)
if(buy)
    strategy.entry("buy",strategy.long,qty = qn)
    strategy.exit("Stop","buy",limit = longTake,stop = longStop)

if(sell)
    strategy.entry("sell",strategy.short,qty = qn)
    strategy.exit("Stop","sell",limit = shortTake,stop = shortStop)

strategy.close("buy",when =  longTPhit or sell or longSLhit, comment = "Target")
strategy.close("sell",when =  shortSLhit or shortTPhit or buy , comment = "Stop Loss")

strategy.cancel("buy",when =  longTPhit or sell or longSLhit)
strategy.cancel("sell",when =  shortSLhit or shortTPhit or buy )