Strategi tangkapan titik rendah berdasarkan regresi linear pembaikan Vix
Gambaran keseluruhan
Idea utama strategi ini adalah untuk menangkap titik rendah pasaran dengan tepat dengan menggabungkan indikator pembaikan Wix dan regresi linearnya. Strategi ini dinamakan “Pemulihan titik rendah regresi linear”.
Prinsip Strategi
- Mengira Indeks Pembaikan Wix, ia lebih baik untuk menilai tahap rendah pasaran
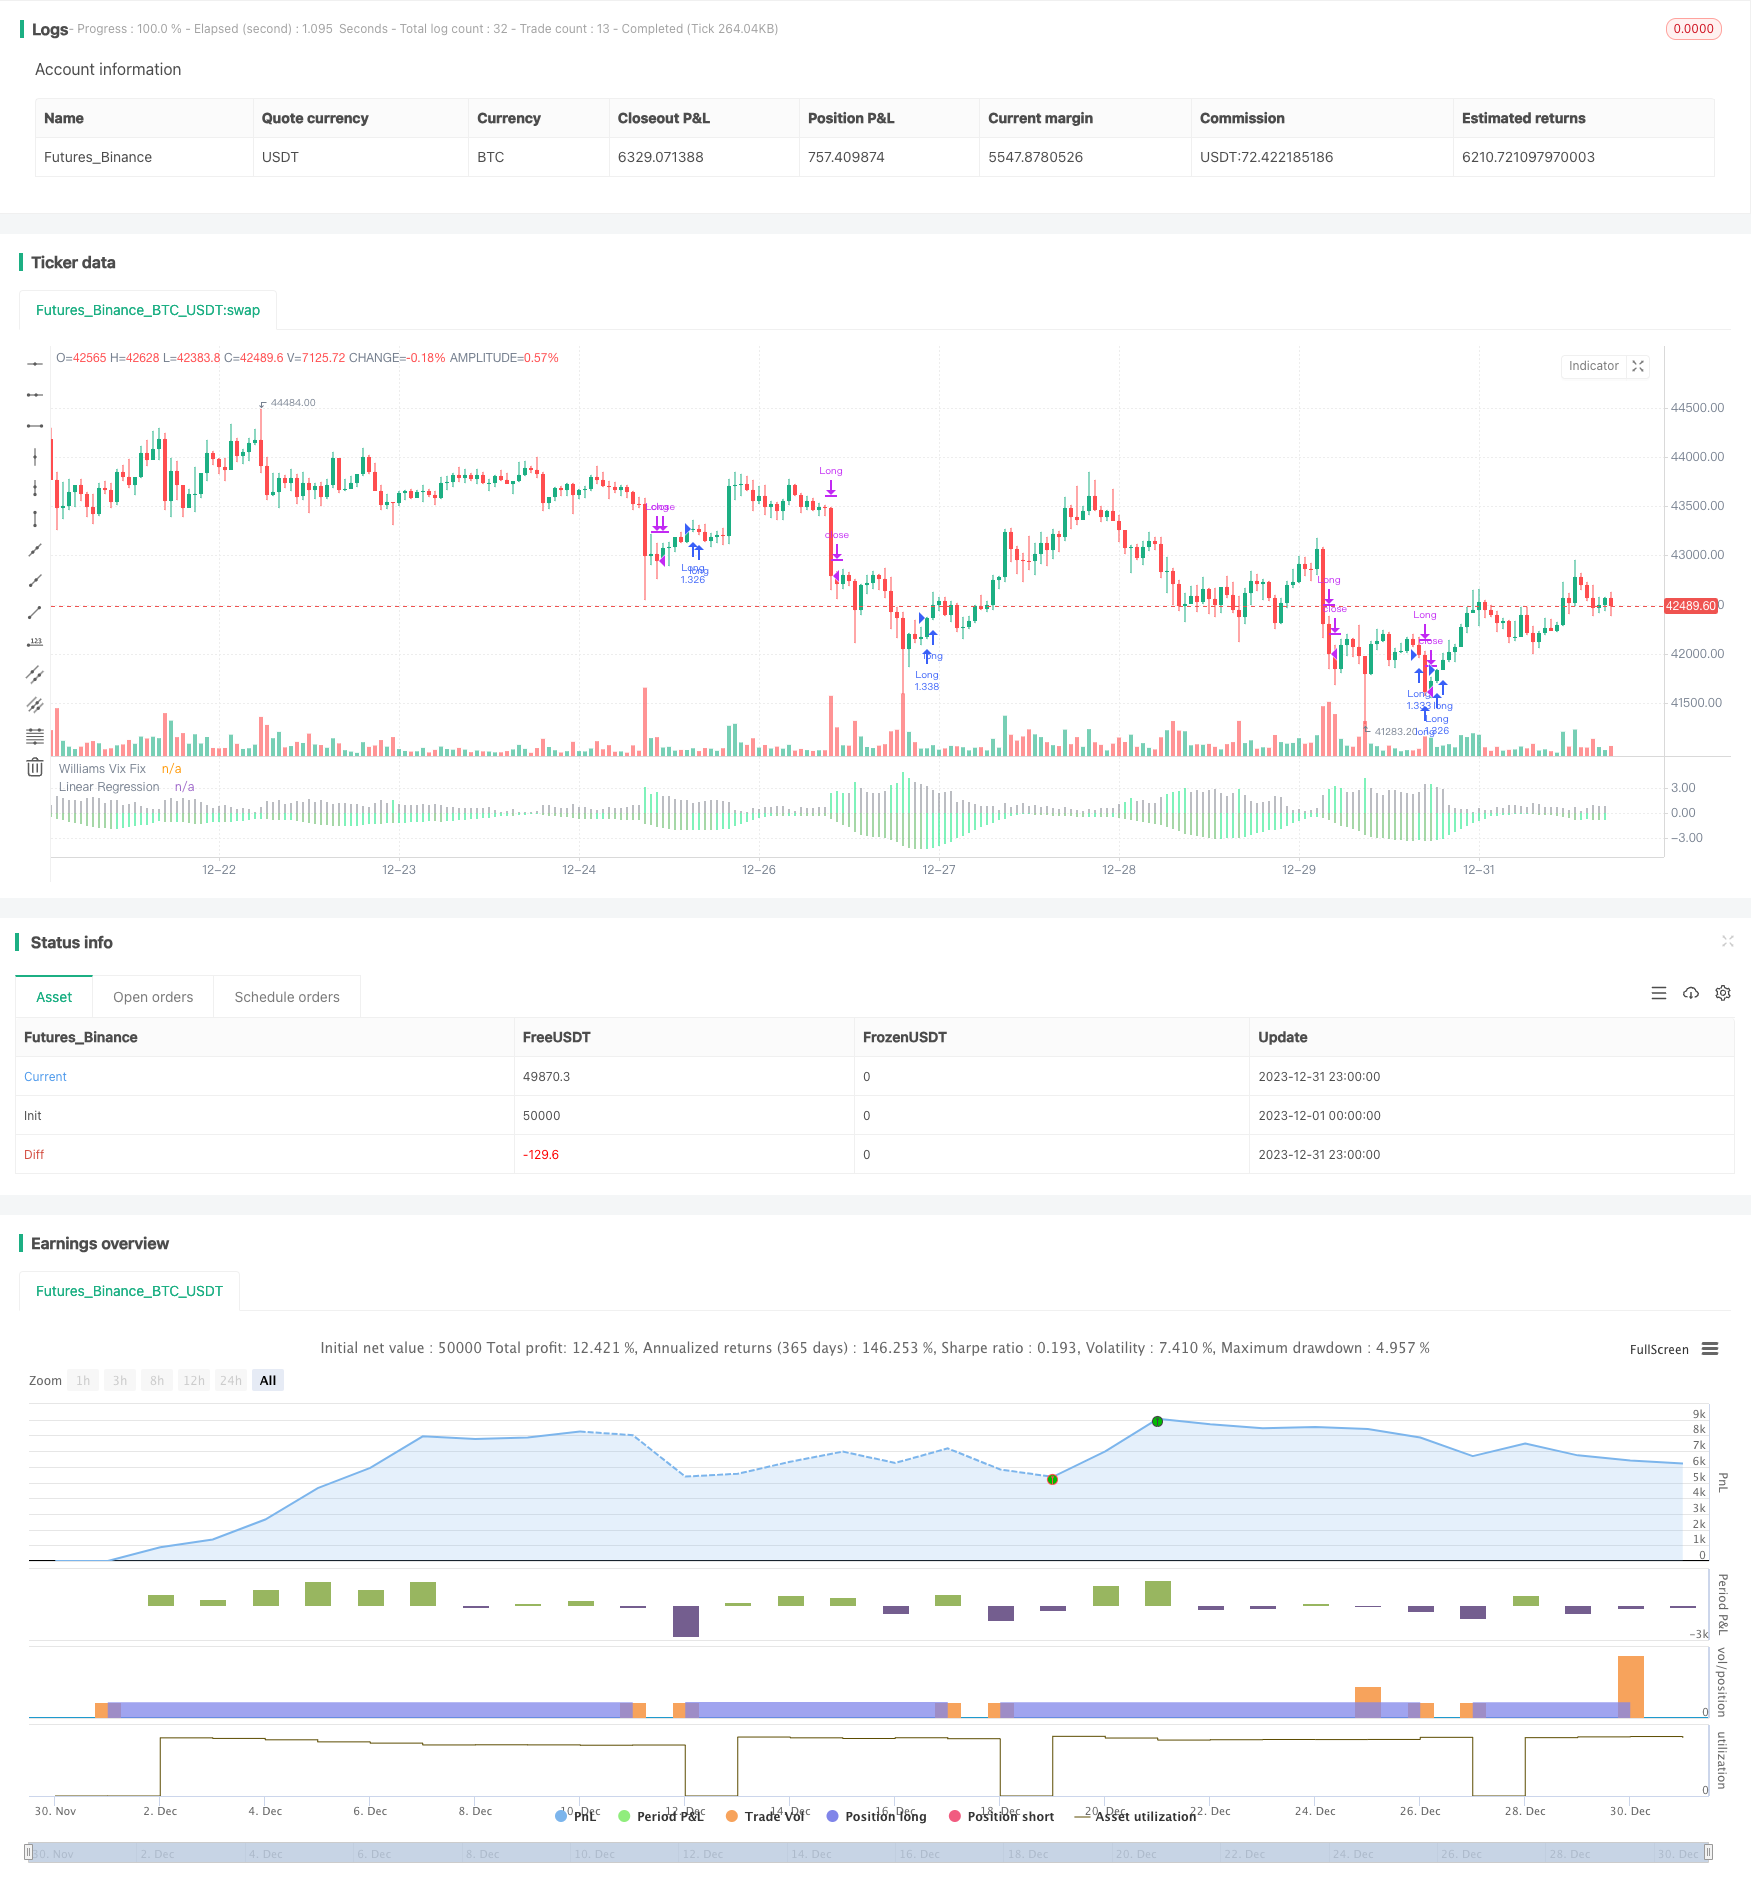
- Garis regresi linear digunakan untuk penunjuk pembaikan Wix. Apabila histogram regresi linear bertukar warna menjadi hijau, menunjukkan regresi linear pembaikan Wix mula naik, isyarat pembelian boleh dikeluarkan
- Bersama-sama dengan tiang hijau dalam indeks pembaikan Wix, anda boleh mengesahkan masa pembelian lebih lanjut
- Apabila histogram regresi linear bertukar warna menjadi merah, ia menunjukkan bahawa regresi linear yang diperbaiki oleh Vix mula menurun dan memberi isyarat menjual
Proses di atas, menggunakan regresi linear untuk meningkatkan ketepatan dan ketepatan masa isyarat penunjuk pembaikan Wix, menapis beberapa isyarat palsu, dan dengan itu menangkap titik rendah dengan tepat.
Analisis kelebihan
- Strategi menggunakan penapis regresi linear untuk membetulkan isyarat palsu sebahagiannya dalam indikator Vix untuk menjadikan isyarat beli/jual lebih tepat dan lebih dipercayai
- Regresi linear meningkatkan kepekaan dan ketepatan masa isyarat dan dapat menangkap titik-titik perubahan pasaran dengan cepat
- Logik strategi mudah dan jelas, mudah difahami untuk pelaksanaan, sesuai untuk perdagangan kuantitatif
- Lebih banyak parameter yang boleh dikonfigurasi, boleh disesuaikan dengan perubahan pasaran
Risiko dan penyelesaian
- Strategi ini digunakan terutamanya untuk menilai tahap rendah pasaran secara keseluruhan dan tidak sesuai untuk saham individu
- Regresi linear tidak dapat menyaring isyarat palsu sepenuhnya, dan dengan pengetua Vix dapat mengurangkan risiko
- Parameter perlu diselaraskan dengan keadaan yang berubah untuk mengelakkan kegagalan
- Dianjurkan untuk digunakan bersama-sama dengan penunjuk lain untuk mengesahkan lebih lanjut.
Arah pengoptimuman
- Ia boleh dipertimbangkan untuk digabungkan dengan penunjuk kadar oval atau penunjuk kuantitatif untuk menapis lebih lanjut.
- Kaedah untuk mengoptimumkan penyesuaian parameter yang boleh dipelajari untuk menjadikan strategi lebih bijak
- Kaedah pembelajaran mesin boleh diterokai untuk menggunakan model yang lebih kompleks untuk meramalkan pergerakan pembaikan Wix
- Anda boleh cuba menggunakan kaedah yang sama untuk saham individu dan melihat bagaimana anda boleh menapis isyarat palsu.
ringkaskan
Strategi ini menggunakan Wix untuk membetulkan indikator untuk menentukan titik rendah, sementara memperkenalkan regresi linear untuk meningkatkan kualiti isyarat, sehingga dapat menangkap titik rendah pasaran dengan berkesan. Strategi ini mudah digunakan, hasilnya lebih baik, risiko utama adalah kegagalan penapisan sepenuhnya pada isyarat palsu. Kami masih perlu mengoptimumkan parameter dan mempertimbangkan untuk memperkenalkan cara lain untuk mengkonfirmasi isyarat lebih lanjut, menjadikan strategi lebih sempurna.
/*backtest
start: 2023-12-01 00:00:00
end: 2023-12-31 23:59:59
period: 1h
basePeriod: 15m
exchanges: [{"eid":"Futures_Binance","currency":"BTC_USDT"}]
*/

// This source code is subject to the terms of the Mozilla Public License 2.0 at https://mozilla.org/MPL/2.0/
// © HeWhoMustNotBeNamed

//@version=4
strategy("VixFixLinReg-Strategy", shorttitle="VixFixLinReg - Strategy",
                     overlay=false, initial_capital = 100000,
                     default_qty_type = strategy.percent_of_equity, default_qty_value = 100, commission_type = strategy.commission.percent, pyramiding = 1,
                     commission_value = 0.01)
pd = input(22, title="LookBack Period Standard Deviation High")
bbl = input(20, title="Bolinger Band Length")
mult = input(2.0    , minval=1, maxval=5, title="Bollinger Band Standard Devaition Up")
lb = input(50  , title="Look Back Period Percentile High")
ph = input(.85, title="Highest Percentile - 0.90=90%, 0.95=95%, 0.99=99%")
pl = input(1.01, title="Lowest Percentile - 1.10=90%, 1.05=95%, 1.01=99%")
hp = input(false, title="Show High Range - Based on Percentile and LookBack Period?")
sd = input(false, title="Show Standard Deviation Line?")
i_startTime = input(defval = timestamp("01 Jan 2010 00:00 +0000"), title = "Start Time", type = input.time)
i_endTime = input(defval = timestamp("01 Jan 2099 00:00 +0000"), title = "End Time", type = input.time)
inDateRange = true
considerVIXFixClose = input(false)
lengthKC=input(20, title="KC Length")
multKC = input(1.5, title="KC MultFactor")

atrLen = input(22)
atrMult = input(5)
initialStopBar = input(5)
waitForCloseBeforeStop = input(true)
f_getStop(atrLen, atrMult)=>
    stop = strategy.position_size > 0 ? close - (atrMult * atr(atrLen)) : lowest(initialStopBar)
    stop := strategy.position_size > 0 ? max(stop,nz(stop[1], stop)) : lowest(initialStopBar)
    stop

wvf = ((highest(close, pd)-low)/(highest(close, pd)))*100

sDev = mult * stdev(wvf, bbl)
midLine = sma(wvf, bbl)
lowerBand = midLine - sDev
upperBand = midLine + sDev

rangeHigh = (highest(wvf, lb)) * ph
rangeLow = (lowest(wvf, lb)) * pl


col = wvf >= upperBand or wvf >= rangeHigh ? color.lime : color.gray

val = linreg(wvf, pd, 0)
absVal = abs(val)

linRegColor = val>val[1]? (val > 0 ? color.green : color.orange): (val > 0 ? color.lime : color.red)
plot(hp and rangeHigh ? rangeHigh : na, title="Range High Percentile", style=plot.style_line, linewidth=4, color=color.orange)
plot(hp and rangeLow ? rangeLow : na, title="Range High Percentile", style=plot.style_line, linewidth=4, color=color.orange)
plot(wvf, title="Williams Vix Fix", style=plot.style_histogram, linewidth = 4, color=col)
plot(sd and upperBand ? upperBand : na, title="Upper Band", style=plot.style_line, linewidth = 3, color=color.aqua)

plot(-absVal, title="Linear Regression", style=plot.style_histogram, linewidth=4, color=linRegColor)

vixFixState = (col == color.lime) ? 1: 0
vixFixState := strategy.position_size == 0? max(vixFixState, nz(vixFixState[1],0)) : vixFixState

longCondition = (vixFixState == 1 and linRegColor == color.lime) and inDateRange
exitLongCondition = (linRegColor == color.orange or linRegColor == color.red) and considerVIXFixClose

stop = f_getStop(atrLen, atrMult)
label_x = time+(60*60*24*1000*20)
myLabel = label.new(x=label_x, y=0, text="Stop : "+tostring(stop), xloc=xloc.bar_time, style=label.style_none, textcolor=color.black, size=size.normal)
label.delete(myLabel[1])
strategy.entry("Long", strategy.long, when=longCondition, oca_name="oca_buy")
strategy.close("Long", when=exitLongCondition or (close < stop and waitForCloseBeforeStop and linRegColor == color.green))
strategy.exit("ExitLong", "Long", stop = stop, when=not waitForCloseBeforeStop and linRegColor == color.green)