Strategi penjejakan momentum merentas rangka masa
Gambaran keseluruhan
Strategi ini mewujudkan pengesanan dinamik merentasi bingkai masa dengan menggabungkan 123 reversal dan MACD. 123 reversal menilai titik reversal trend jangka pendek, MACD menilai trend jangka panjang, kedua-duanya digabungkan untuk mencapai reversal jangka pendek sambil mengunci isyarat polygon trend jangka panjang.
Prinsip Strategi
Strategi ini terdiri daripada dua bahagian:
123 Bahagian pembalikan: dua garis K semasa membentuk titik tinggi / rendah, dan menghasilkan isyarat beli / jual apabila penunjuk rawak berada di bawah / di atas 50.
Bahagian MACD: Sinyal beli dihasilkan semasa melintasi garis pendek pada garis cepat, dan sinyal jual dihasilkan semasa melintasi garis pendek di bawah garis cepat.
Akhirnya menggabungkan kedua-dua, iaitu apabila 123 berbalik dan MACD juga menghasilkan isyarat arah, isyarat akhir dikeluarkan.
Analisis kelebihan
Strategi ini menggabungkan pembalikan jangka pendek dan trend jangka panjang, yang dapat mengunci trend jangka panjang dalam turun naik jangka pendek, dan dengan itu memperoleh kadar kemenangan yang lebih tinggi. Terutama dalam keadaan yang bergolak, pembalikan 123 dapat memadamkan sebahagian bunyi, dan dengan itu meningkatkan kestabilan.
Selain itu, dengan menyesuaikan parameter, anda boleh menyeimbangkan nisbah isyarat pembalikan dan isyarat trend, menyesuaikan diri dengan keadaan pasaran yang berbeza.
Analisis risiko
Strategi ini mempunyai kelewatan masa tertentu, terutamanya apabila menggunakan MACD jangka panjang, dan mungkin terlepas pergerakan jangka pendek. Selain itu, isyarat pembalikan itu sendiri mempunyai tahap keacakan dan mudah ditangkap.
Anda boleh memendekkan kitaran MACD atau menambah stop loss untuk mengawal risiko.
Arah pengoptimuman
Strategi ini boleh dioptimumkan dalam beberapa aspek:
Sesuaikan 123 parameter pembalikan untuk mengoptimumkan kesan pembalikan
Menyesuaikan parameter MACD untuk mengoptimumkan penilaian trend
Menambah penapisan untuk penunjuk lain untuk meningkatkan keberkesanan
Meningkatkan strategi penangguhan kerugian dan mengawal risiko
ringkaskan
Strategi ini mengintegrasikan pelbagai parameter dan indikator teknikal dari pelbagai bingkai masa, mengimbangi kelebihan perdagangan berbalik dan perdagangan trend dengan mengesan dinamik merentasi bingkai masa. Kesan keseimbangan boleh disesuaikan melalui parameter, dan boleh diperkenalkan lebih banyak indikator atau berhenti untuk pengoptimuman, adalah idea strategi yang sangat berpotensi.
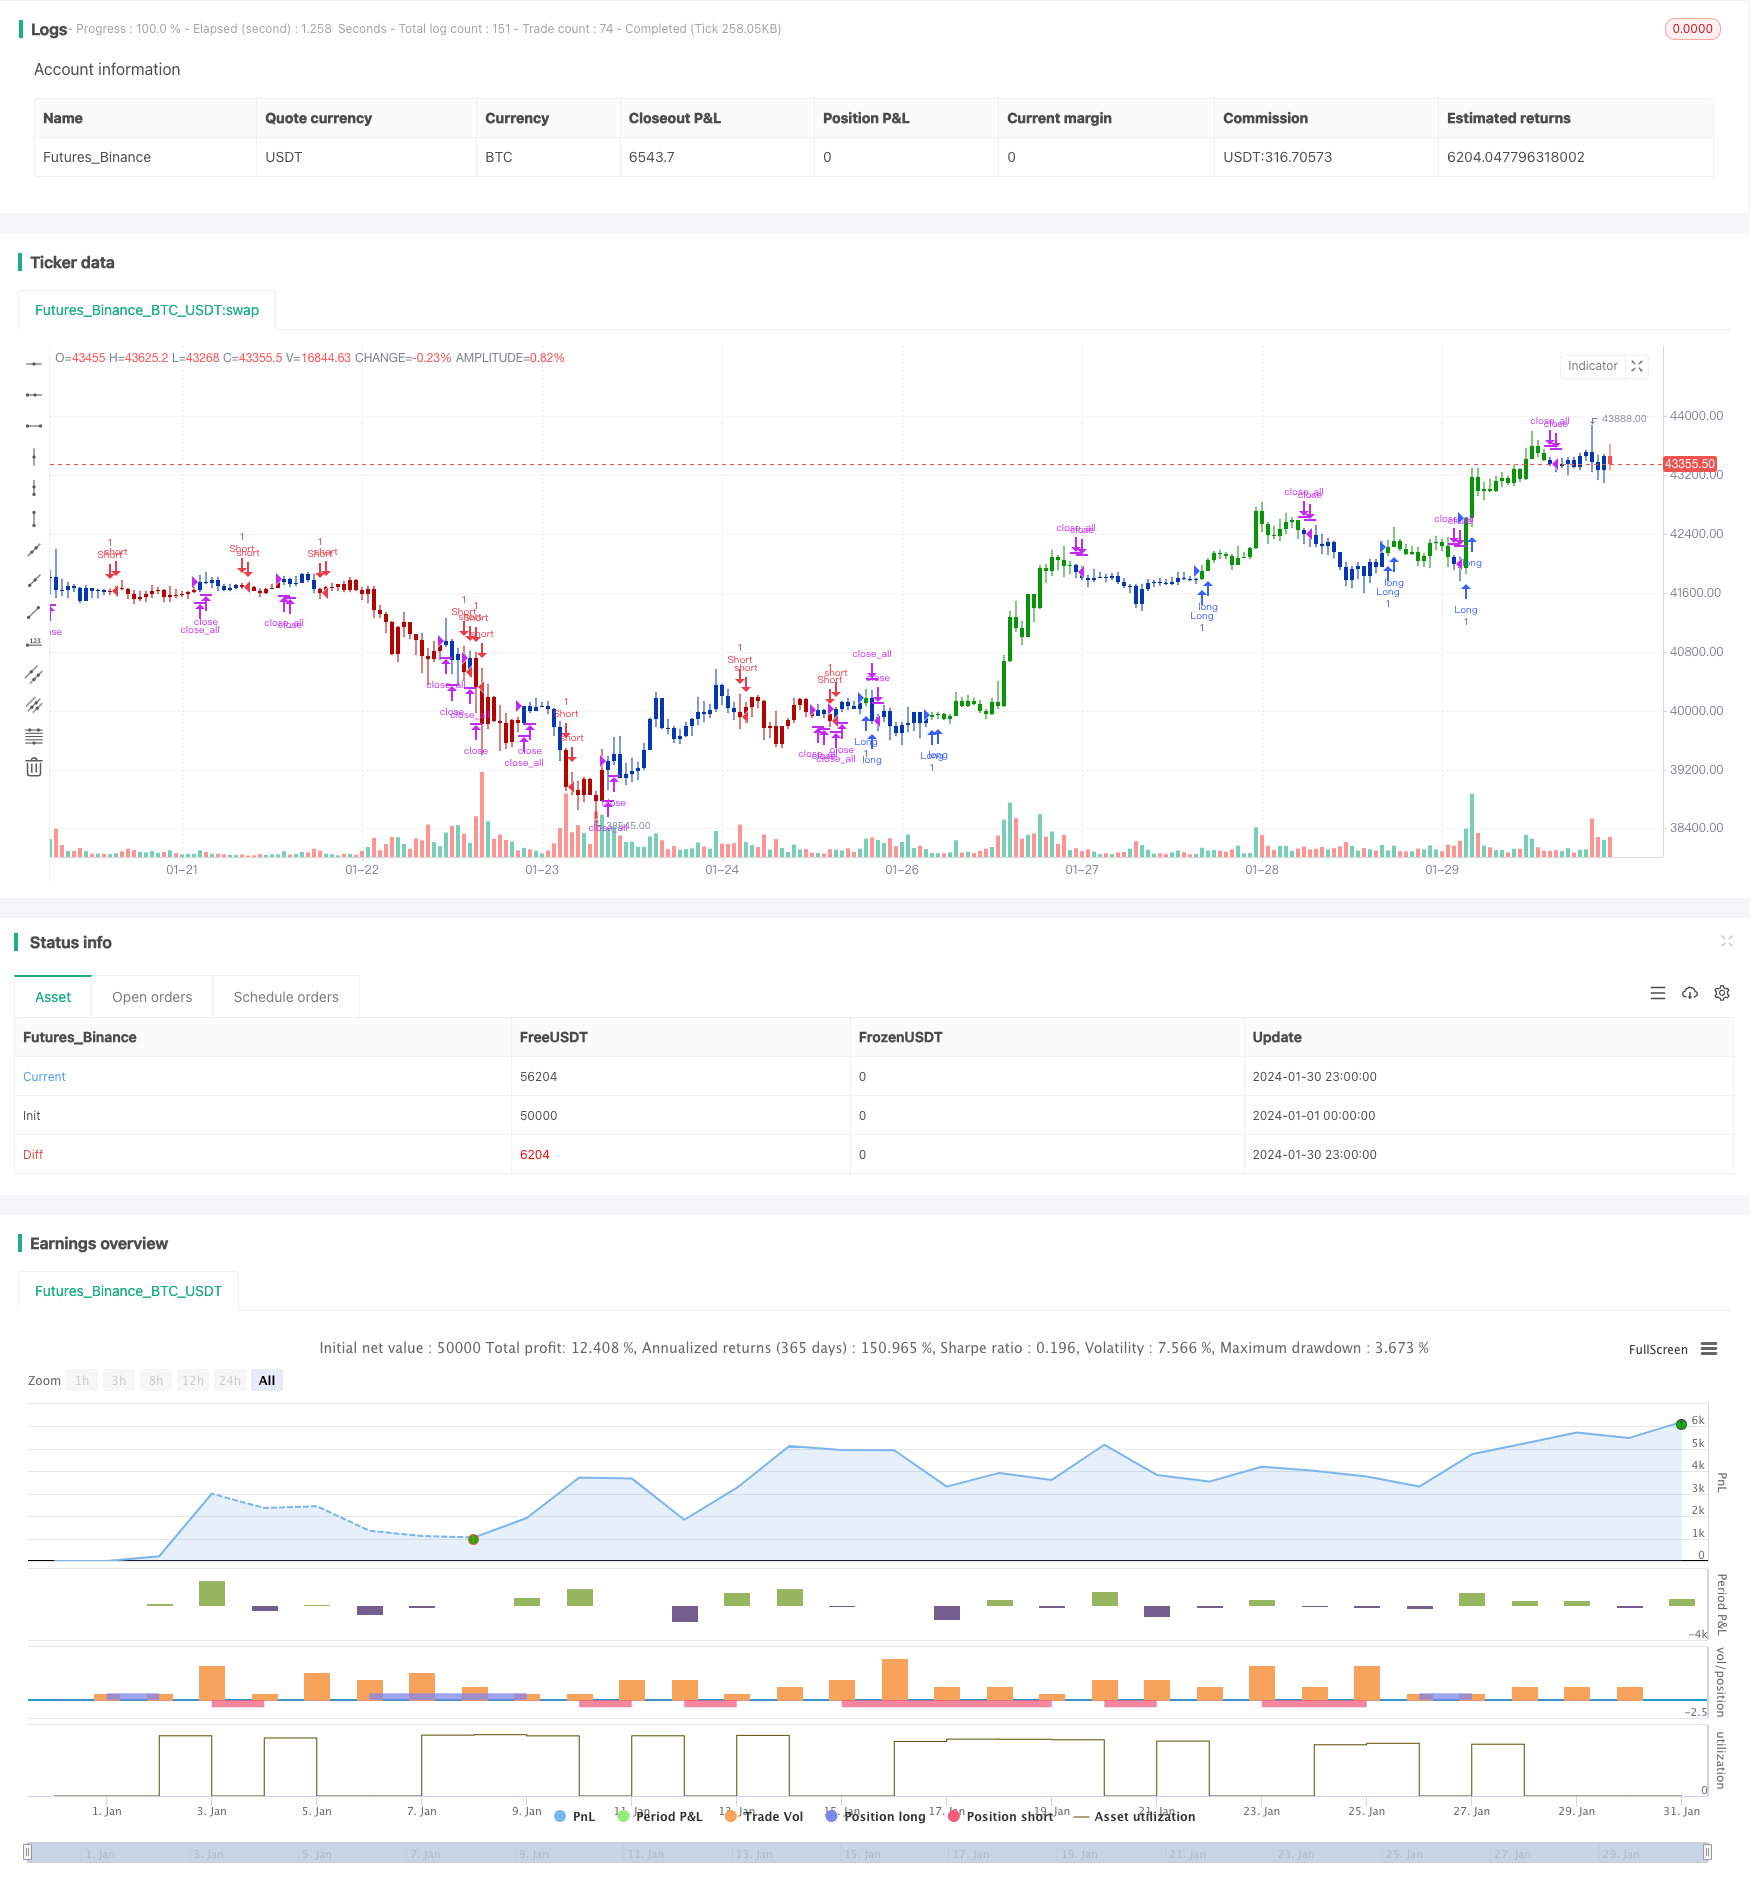
/*backtest
start: 2024-01-01 00:00:00
end: 2024-01-31 00:00:00
period: 1h
basePeriod: 15m
exchanges: [{"eid":"Futures_Binance","currency":"BTC_USDT"}]
*/

//@version=4
////////////////////////////////////////////////////////////
//  Copyright by HPotter v1.0 28/01/2021
// This is combo strategies for get a cumulative signal.
//
// First strategy
// This System was created from the Book "How I Tripled My Money In The
// Futures Market" by Ulf Jensen, Page 183. This is reverse type of strategies.
// The strategy buys at market, if close price is higher than the previous close
// during 2 days and the meaning of 9-days Stochastic Slow Oscillator is lower than 50.
// The strategy sells at market, if close price is lower than the previous close price
// during 2 days and the meaning of 9-days Stochastic Fast Oscillator is higher than 50.
//
// Second strategy
// MACD – Moving Average Convergence Divergence. The MACD is calculated
// by subtracting a 26-day moving average of a security's price from a
// 12-day moving average of its price. The result is an indicator that
// oscillates above and below zero. When the MACD is above zero, it means
// the 12-day moving average is higher than the 26-day moving average.
// This is bullish as it shows that current expectations (i.e., the 12-day
// moving average) are more bullish than previous expectations (i.e., the
// 26-day average). This implies a bullish, or upward, shift in the supply/demand
// lines. When the MACD falls below zero, it means that the 12-day moving average
// is less than the 26-day moving average, implying a bearish shift in the
// supply/demand lines.
// A 9-day moving average of the MACD (not of the security's price) is usually
// plotted on top of the MACD indicator. This line is referred to as the "signal"
// line. The signal line anticipates the convergence of the two moving averages
// (i.e., the movement of the MACD toward the zero line).
// Let's consider the rational behind this technique. The MACD is the difference
// between two moving averages of price. When the shorter-term moving average rises
// above the longer-term moving average (i.e., the MACD rises above zero), it means
// that investor expectations are becoming more bullish (i.e., there has been an
// upward shift in the supply/demand lines). By plotting a 9-day moving average of
// the MACD, we can see the changing of expectations (i.e., the shifting of the
// supply/demand lines) as they occur.
//
// WARNING:
// - For purpose educate only
// - This script to change bars colors.
////////////////////////////////////////////////////////////
Reversal123(Length, KSmoothing, DLength, Level) =>
    vFast = sma(stoch(close, high, low, Length), KSmoothing)
    vSlow = sma(vFast, DLength)
    pos = 0.0
    pos := iff(close[2] < close[1] and close > close[1] and vFast < vSlow and vFast > Level, 1,
	         iff(close[2] > close[1] and close < close[1] and vFast > vSlow and vFast < Level, -1, nz(pos[1], 0)))
	pos

MACD(fastLength,slowLength,signalLength) =>
    pos = 0.0
    fastMA = ema(close, fastLength)
    slowMA = ema(close, slowLength)
    macd = fastMA - slowMA
    signal = sma(macd, signalLength)
    pos:= iff(signal < macd , 1,
	       iff(signal > macd, -1, nz(pos[1], 0)))
    pos

strategy(title="Combo Backtest 123 Reversal & MACD Crossover", shorttitle="Combo", overlay = true)
line1 = input(true, "---- 123 Reversal ----")
Length = input(14, minval=1)
KSmoothing = input(1, minval=1)
DLength = input(3, minval=1)
Level = input(50, minval=1)
//-------------------------
fastLength = input(8, minval=1)
slowLength = input(16,minval=1)
signalLength=input(11,minval=1)
xSeria = input(title="Source", type=input.source, defval=close)
reverse = input(false, title="Trade reverse")
posReversal123 = Reversal123(Length, KSmoothing, DLength, Level)
posMACD = MACD(fastLength,slowLength, signalLength)
pos = iff(posReversal123 == 1 and posMACD == 1 , 1,
	   iff(posReversal123 == -1 and posMACD == -1, -1, 0))
possig = iff(reverse and pos == 1, -1,
          iff(reverse and pos == -1 , 1, pos))
if (possig == 1)
    strategy.entry("Long", strategy.long)
if (possig == -1)
    strategy.entry("Short", strategy.short)
if (possig == 0)
    strategy.close_all()
barcolor(possig == -1 ? #b50404: possig == 1 ? #079605 : #0536b3 )