Trend Mengikuti Strategi Pembalikan Henti
Gambaran keseluruhan
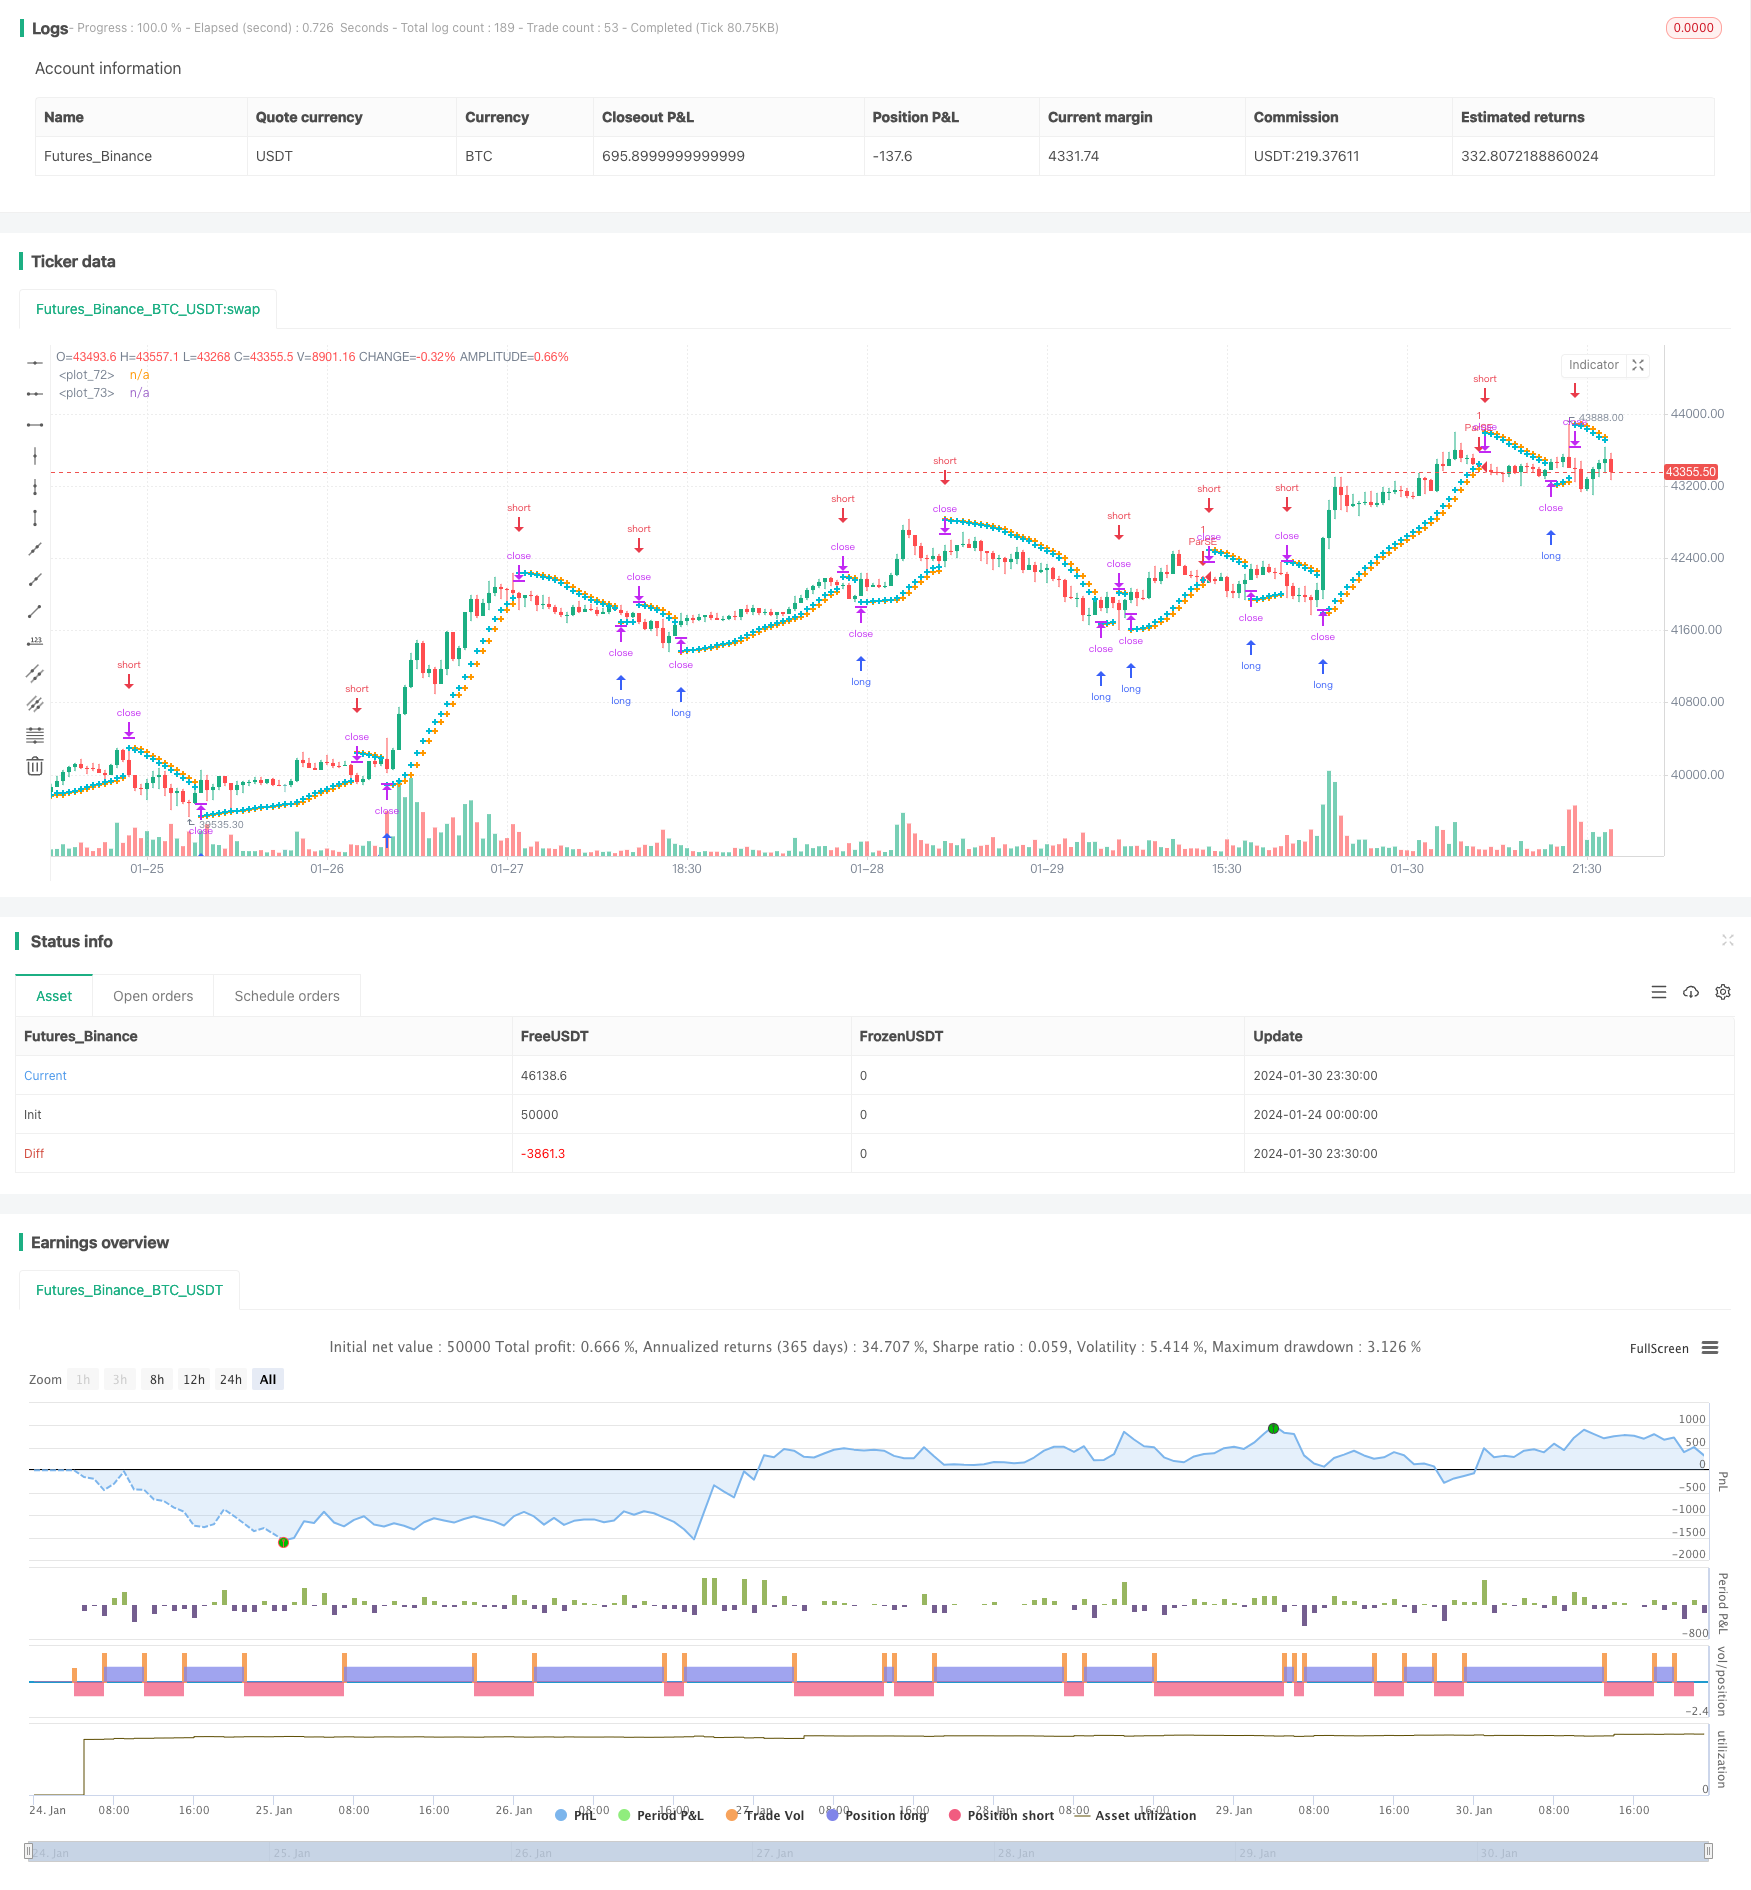
Trend Tracking Stop Loss Reversal Strategy adalah strategi yang menggunakan indikator Parabolic SAR untuk mengenal pasti trend dan memasuki kedudukan terbalik apabila trend berbalik. Strategi ini menggabungkan mekanisme berhenti dan berhenti untuk mengawal risiko.
Prinsip Strategi
Strategi ini menggunakan penunjuk Parabolic SAR untuk menilai trend pasaran semasa. Nama penuh Parabolic SAR adalah Parabolic Stop and Reverse , yang menunjukkan bahawa paras paras paras berhenti dan berbalik.
Apabila titik SAR turun dan lebih rendah daripada harga, ia mewakili trend bullish; apabila titik SAR naik dan lebih tinggi daripada harga, ia mewakili trend bearish. Strategi ini adalah untuk menilai arah trend semasa berdasarkan kedudukan titik SAR.
Khususnya, apabila titik SAR meningkat dan lebih tinggi daripada harga, strategi akan melakukan kedudukan kosong; apabila titik SAR menurun dan lebih rendah daripada harga, strategi akan melakukan perdagangan. Iaitu, memasuki kedudukan terbalik apabila titik SAR menunjukkan pembalikan trend.
Di samping itu, strategi ini juga menetapkan mekanisme berhenti dan berhenti. Apabila terlalu banyak dilakukan, kemungkinan untuk menetapkan harga berhenti untuk mengehadkan kerugian; Pada masa yang sama, mungkin untuk menetapkan harga berhenti, untuk melonggarkan kedudukan setelah harga mencapai keuntungan sasaran tertentu.
Analisis kelebihan
Strategi ini menggabungkan indikator trend dan mekanisme stop loss / stop loss, dengan kelebihan utama:
- Ia boleh menangkap peluang untuk membalikkan trend dan melakukan operasi terbalik.
- Setelah menetapkan stop loss dan stop loss, anda boleh mengawal risiko dan keuntungan secara aktif.
- Parabolic SAR adalah penunjuk pembalikan trend yang agak biasa digunakan, dan ia lebih berkesan.
- Peraturan-peraturan strategi mudah difahami dan dilaksanakan.
Analisis risiko
Strategi ini juga mempunyai risiko yang perlu diperhatikan:
- Parabolic SAR tidak sempurna dan kadangkala memberi isyarat yang salah.
- Penetapan harga stop loss atau stop stop perlu munasabah, jika tidak, ia mungkin terlambat.
- Bayaran bayaran juga mempengaruhi keuntungan akhir.
- Selepas pembalikan, trend baru lengthening mungkin agak singkat.
Untuk menangani risiko ini, anda boleh menyesuaikan parameter yang dioptimumkan, atau memfilterkan dengan penunjuk lain.
Arah pengoptimuman
Strategi ini boleh dioptimumkan dalam beberapa arah:
- Mengoptimumkan parameter Parabolic SAR untuk mencari kombinasi parameter terbaik.
- Cubalah pelbagai strategi penangguhan kerugian, seperti penangguhan kerugian mengikut dan sebagainya.
- Tambah petunjuk atau syarat untuk menapis isyarat perdagangan reverse.
- Tambah kawalan kedudukan untuk memperluas atau mengurangkan kedudukan mengikut keadaan pasaran.
- Parameter penyesuaian untuk pelbagai jenis transaksi.
ringkaskan
Strategi ini adalah strategi perdagangan yang lebih klasik secara keseluruhan. Ia berfungsi untuk mengenal pasti trend yang berbalik, sambil mengawal risiko dengan cara menghentikan dan menghentikan kerugian. Dengan pengoptimuman, ia boleh menjadi strategi yang bernilai saham.
/*backtest
start: 2024-01-24 00:00:00
end: 2024-01-31 00:00:00
period: 30m
basePeriod: 15m
exchanges: [{"eid":"Futures_Binance","currency":"BTC_USDT"}]
*/

//@version=4
strategy("Parabolic SAR Strategy", overlay=true)
start = input(0.02)
increment = input(0.02)
maximum = input(0.2)
var bool uptrend = na
var float EP = na
var float SAR = na
var float AF = start
var float nextBarSAR = na
if bar_index > 0
	firstTrendBar = false
	SAR := nextBarSAR
	if bar_index == 1
		float prevSAR = na
		float prevEP = na
		lowPrev = low[1]
		highPrev = high[1]
		closeCur = close
		closePrev = close[1]
		if closeCur > closePrev
			uptrend := true
			EP := high
			prevSAR := lowPrev
			prevEP := high
		else
			uptrend := false
			EP := low
			prevSAR := highPrev
			prevEP := low
		firstTrendBar := true
		SAR := prevSAR + start * (prevEP - prevSAR)
	if uptrend
		if SAR > low
			firstTrendBar := true
			uptrend := false
			SAR := max(EP, high)
			EP := low
			AF := start
	else
		if SAR < high
			firstTrendBar := true
			uptrend := true
			SAR := min(EP, low)
			EP := high
			AF := start
	if not firstTrendBar
		if uptrend
			if high > EP
				EP := high
				AF := min(AF + increment, maximum)
		else
			if low < EP
				EP := low
				AF := min(AF + increment, maximum)
	if uptrend
		SAR := min(SAR, low[1])
		if bar_index > 1
			SAR := min(SAR, low[2])
	else
		SAR := max(SAR, high[1])
		if bar_index > 1
			SAR := max(SAR, high[2])
	nextBarSAR := SAR + AF * (EP - SAR)
	if barstate.isconfirmed
		if uptrend
			strategy.entry("ParSE", strategy.short, stop=nextBarSAR, comment="ParSE")
			strategy.cancel("ParLE")
		else
			strategy.entry("ParLE", strategy.long, stop=nextBarSAR, comment="ParLE")
			strategy.cancel("ParSE")
plot(SAR, style=plot.style_cross, linewidth=3, color=color.orange)
plot(nextBarSAR, style=plot.style_cross, linewidth=3, color=color.aqua)
//Stop Loss Inputs
use_short_stop_loss = input(false, title="Short Stop Loss", group="Stop Loss and Take Profit", inline="Short_SL")
short_stop_loss = input(title="(%)", type=input.float, minval=0.0, step=0.1,
     defval=5, group="Stop Loss and Take Profit", inline="Short_SL") * 0.01
use_long_stop_loss = input(false, title="Long Stop Loss", group="Stop Loss and Take Profit", inline="Long_SL")
long_stop_loss = input(title="(%)", type=input.float, minval=0.0, step=0.1,
     defval=5, group="Stop Loss and Take Profit", inline="Long_SL") * 0.01

//Take Profit Inputs
use_short_take_profit = input(false, title="Short Take Profit", group="Stop Loss and Take Profit", inline="Short_TP")
short_take_profit = input(title="(%)", type=input.float, minval=0.0, step=0.1,
     defval = 20, group="Stop Loss and Take Profit", inline="Short_TP") * .01
use_long_take_profit = input(false, title="Long Take Profit", group="Stop Loss and Take Profit", inline="Long_TP")
long_take_profit = input(title="(%)", type=input.float, minval=0.0, step=0.1,
     defval = 20, group="Stop Loss and Take Profit", inline="Long_TP") * .01


longStopPrice  = strategy.position_avg_price * (1 - long_stop_loss)
shortStopPrice = strategy.position_avg_price * (1 + short_stop_loss)
longLimitPrice = strategy.position_avg_price * (1 + long_take_profit)
shortLimitPrice = strategy.position_avg_price * (1 - short_take_profit)


if (strategy.position_size > 0.0)
    if (use_long_stop_loss and not use_long_take_profit)
        strategy.exit("Long", stop = longStopPrice)
    if (use_long_take_profit and not use_long_stop_loss)
        strategy.exit("Long", limit = longLimitPrice)
    if (use_long_take_profit and use_long_stop_loss)
        strategy.exit("Long", stop = longStopPrice, limit=longLimitPrice)
if (strategy.position_size < 0.0)
    if (use_short_stop_loss and not use_short_take_profit)
        strategy.exit("Short", stop = shortStopPrice)
    if (use_short_take_profit and not use_short_stop_loss)
        strategy.exit("Short", limit = shortLimitPrice)
    if (use_short_take_profit and use_short_stop_loss)
        strategy.exit("Short", stop = shortStopPrice, limit = shortLimitPrice)

//plot(strategy.equity, title="equity", color=color.red, linewidth=2, style=plot.style_areabr)