Strategi penumpuan arah momentum dagangan kuantitatif
Gambaran keseluruhan
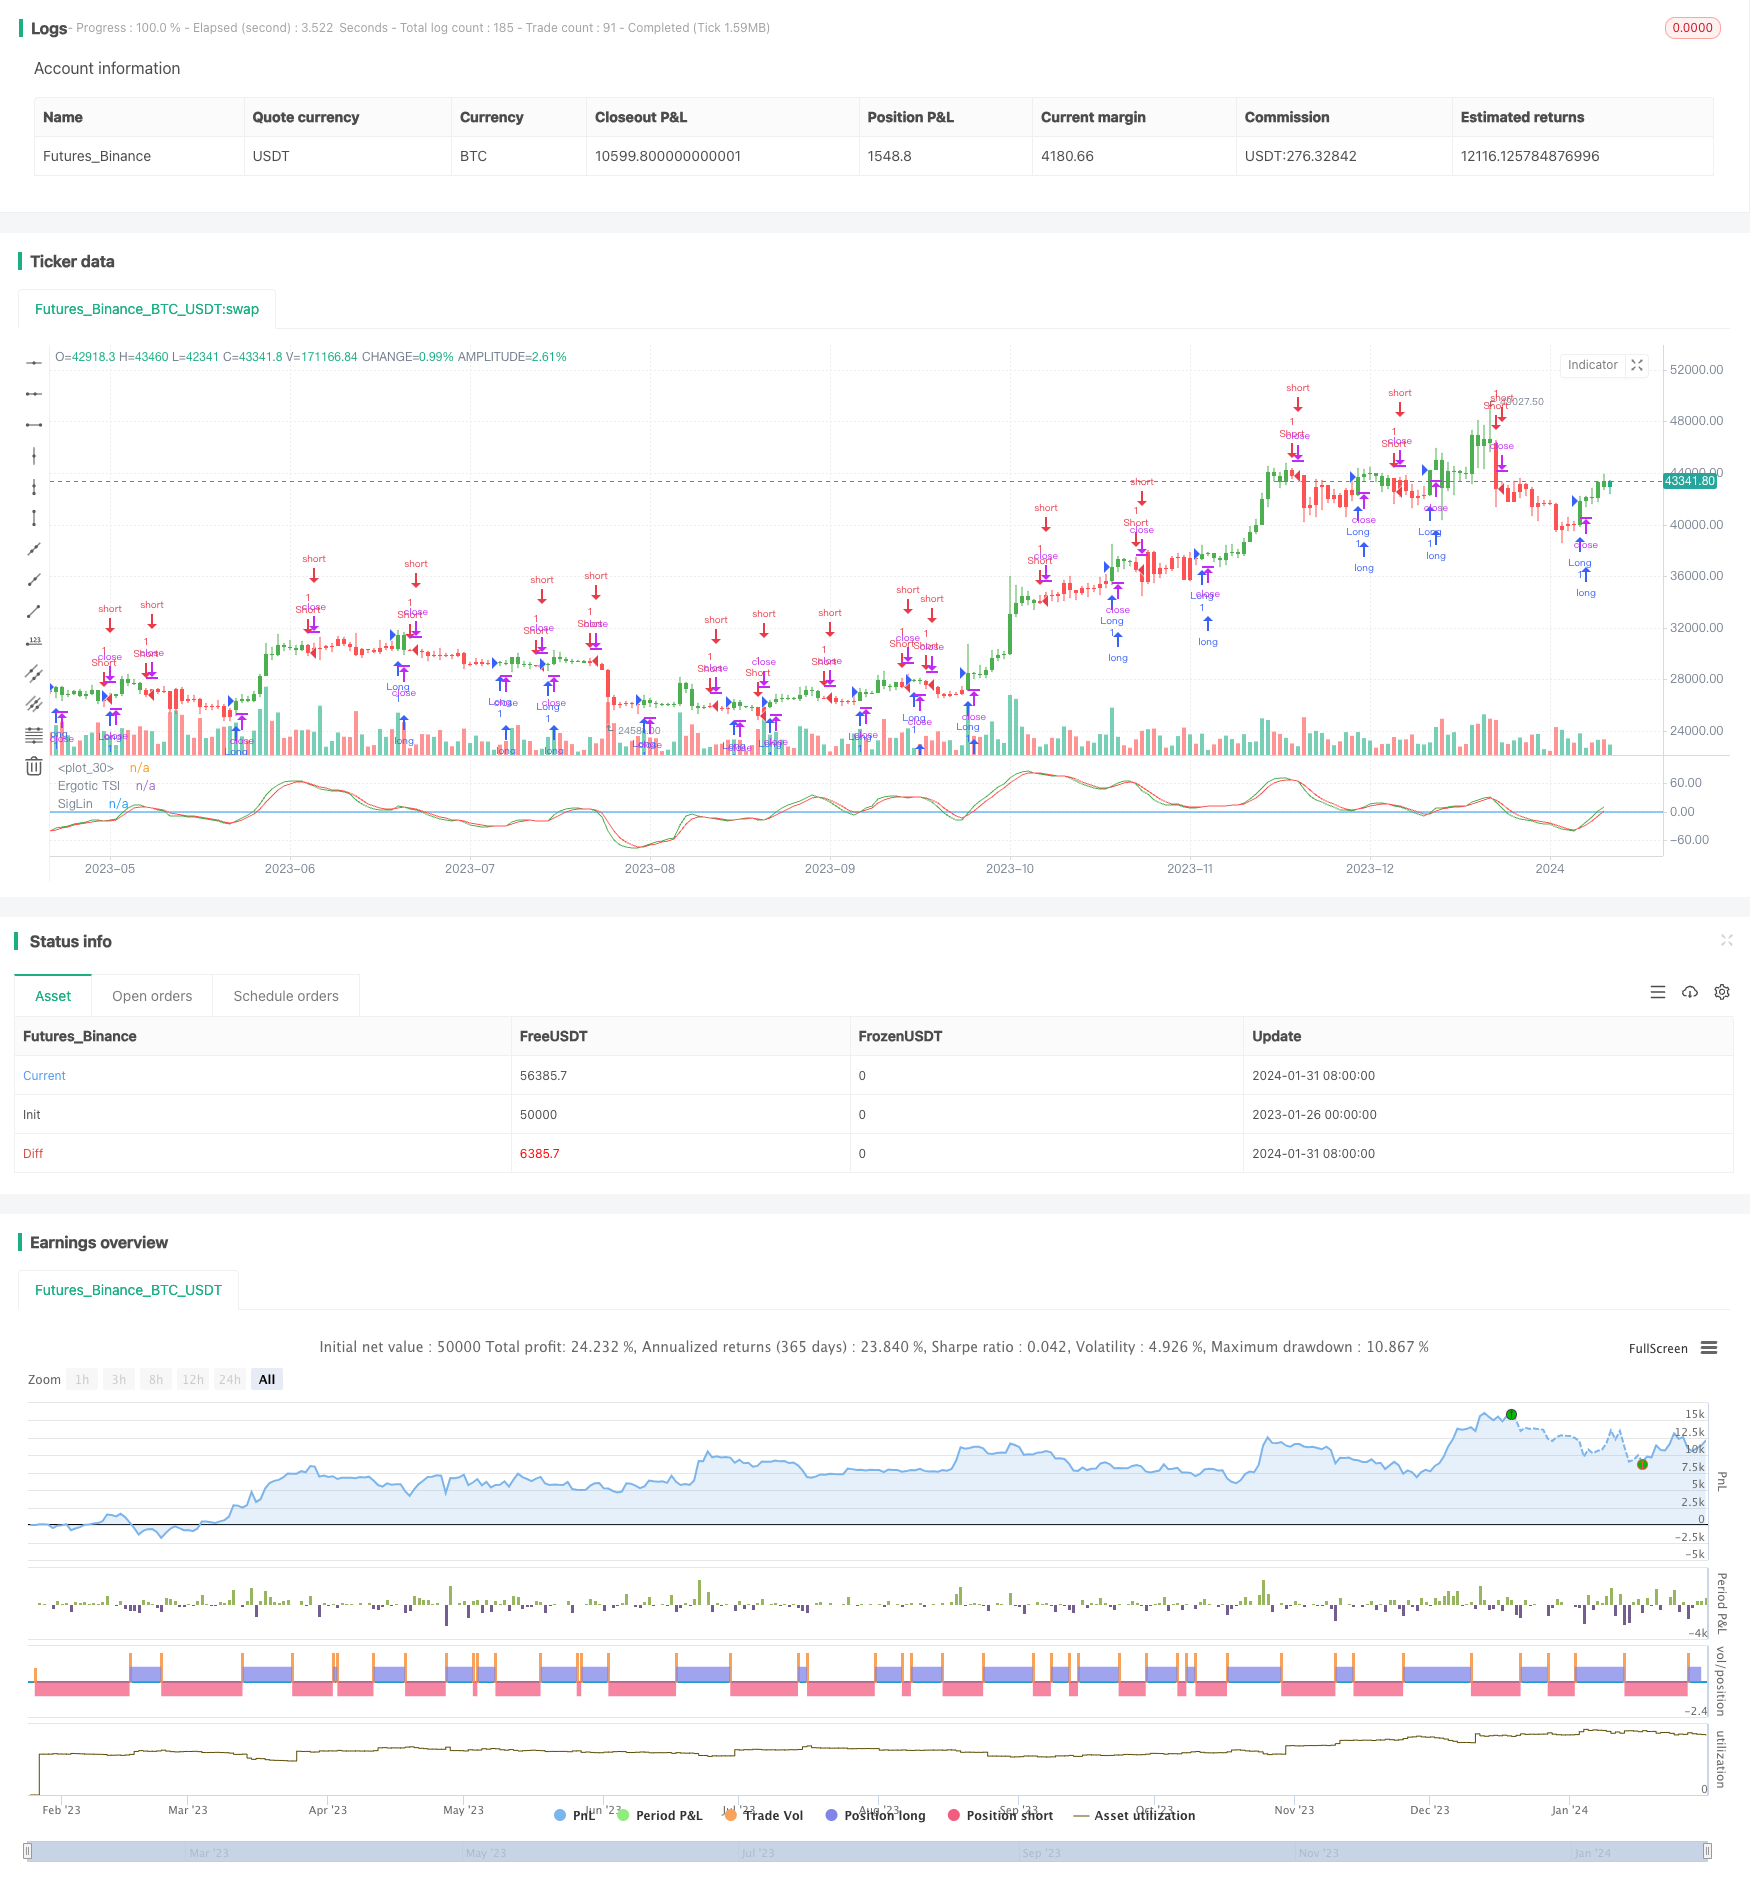
Strategi ini dinamakan “Momentum, Direction and Divergence” dan merupakan strategi perdagangan kuantitatif yang direka berdasarkan petunjuk teknikal yang diterangkan oleh William Blau dalam bukunya “Momentum, Direction and Divergence”. Strategi ini memfokuskan pada tiga dimensi penting iaitu momentum, arah dan konvergensi, untuk menentukan arah trend pasaran dengan mengira petunjuk pergerakan harga saham, dan mencari ketidakseimbangan antara harga dan petunjuk untuk mendapatkan peluang perdagangan.
Prinsip Strategi
Penunjuk teras strategi ini adalah Indeks Kinerja Kecemasan (Ergotic TSI), yang dikira dengan formula berikut:
Val1 = 100 * EMA(EMA(EMA(价格变化量,r),s),u)

Val2 = EMA(EMA(EMA(价格变化量的绝对值,r),s),u)

Ergotic TSI = 如果Val2不等于0,则为Val1/Val2,否则为0
Di antaranya, r, s, u adalah parameter melonggarkan. Penunjuk ini mencerminkan perkadaran perubahan harga kepada nilai mutlak perubahan harga, yang tergolong dalam penunjuk gegaran dinamik. Kemudian kita mengira rata-rata bergerak melonggarkan EMA untuk Ergotic TSI sebagai garis isyarat.
Analisis kelebihan
Strategi ini mempunyai kelebihan utama:
- Keupayaan untuk menangkap trend perubahan harga
- Ini adalah penapis yang baik untuk turun naik harga.
- Dengan ciri-ciri yang lebih baik daripada
- Tetapan parameter yang fleksibel dan boleh disesuaikan kelancaran
Analisis risiko
Strategi ini juga mempunyai risiko:
- Tanda-tanda yang salah apabila trend berbalik
- Tetapan parameter yang tidak betul akan kehilangan peluang perdagangan atau menambah isyarat palsu
- Parameter perlu diselaraskan dengan betul untuk menyesuaikan diri dengan pelbagai jenis dan persekitaran perdagangan
Ia boleh disahkan melalui parameter pengoptimuman, kombinasi indikator lain, dan menetapkan stop loss untuk mengawal risiko.
Arah pengoptimuman
Strategi ini boleh dioptimumkan dalam beberapa aspek:
- Uji input harga yang berbeza, seperti harga buka, harga tutup, dan harga tengah.
- Menyesuaikan nilai parameter halus r, s, u untuk mencari kombinasi parameter terbaik
- Tambah penunjuk lain atau syarat penapisan untuk mengesahkan isyarat lebih lanjut
- Tetapkan titik henti dan mekanisme keluar
ringkaskan
Strategi ini mengambil kira perubahan momentum, penilaian trend dan ciri-ciri yang menyimpang, yang dapat menangkap peluang trend secara berkesan. Dengan pengoptimuman parameter, penapisan isyarat dan kawalan risiko, prestasi strategi yang lebih baik dapat diperoleh. Secara keseluruhan, strategi ini direka dengan lebih masuk akal dan layak untuk kajian dan amalan lanjut.
/*backtest
start: 2023-01-26 00:00:00
end: 2024-02-01 00:00:00
period: 1d
basePeriod: 1h
exchanges: [{"eid":"Futures_Binance","currency":"BTC_USDT"}]
*/

//@version = 2
////////////////////////////////////////////////////////////
//  Copyright by HPotter v1.0 13/12/2016
// r - Length of first EMA smoothing of 1 day momentum        4
// s - Length of second EMA smoothing of 1 day smoothing      8
// u- Length of third EMA smoothing of 1 day momentum         6
// Length of EMA signal line                                  3
// Source of Ergotic TSI                                      Close
//
// This is one of the techniques described by William Blau in his book "Momentum,
// Direction and Divergence" (1995). If you like to learn more, we advise you to
// read this book. His book focuses on three key aspects of trading: momentum,
// direction and divergence. Blau, who was an electrical engineer before becoming
// a trader, thoroughly examines the relationship between price and momentum in
// step-by-step examples. From this grounding, he then looks at the deficiencies
// in other oscillators and introduces some innovative techniques, including a
// fresh twist on Stochastics. On directional issues, he analyzes the intricacies
// of ADX and offers a unique approach to help define trending and non-trending periods.
//
// You can use in the xPrice any series: Open, High, Low, Close, HL2, HLC3, OHLC4 and ect...
// You can change long to short in the Input Settings
// Please, use it only for learning or paper trading. Do not for real trading.
////////////////////////////////////////////////////////////
strategy(title="Ergotic TSI Strategy Backtest")
r = input(4, minval=1)
s = input(8, minval=1)
u = input(6, minval=1)
SmthLen = input(3, minval=1)
reverse = input(false, title="Trade reverse")
hline(0, color=blue, linestyle=line)
xPrice = close
xPrice1 = xPrice - xPrice[1]
xPrice2 = abs(xPrice - xPrice[1])
xSMA_R = ema(ema(ema(xPrice1,r), s),u)
xSMA_aR = ema(ema(ema(xPrice2, r), s),u)
Val1 = 100 * xSMA_R
Val2 = xSMA_aR
xTSI = iff (Val2 != 0, Val1 / Val2, 0)
xEMA_TSI = ema(xTSI, SmthLen)
pos = iff(xTSI > xEMA_TSI, 1,
	   iff(xTSI < xEMA_TSI, -1, nz(pos[1], 0)))
possig = iff(reverse and pos == 1, -1,
          iff(reverse and pos == -1, 1, pos))
if (possig == 1)
    strategy.entry("Long", strategy.long)
if (possig == -1)
    strategy.entry("Short", strategy.short)
barcolor(possig == -1 ? red: possig == 1 ? green : blue )
plot(xTSI, color=green, title="Ergotic TSI")
plot(xEMA_TSI, color=red, title="SigLin")