Strategi Picit Momentum Lazy Bear
Gambaran keseluruhan
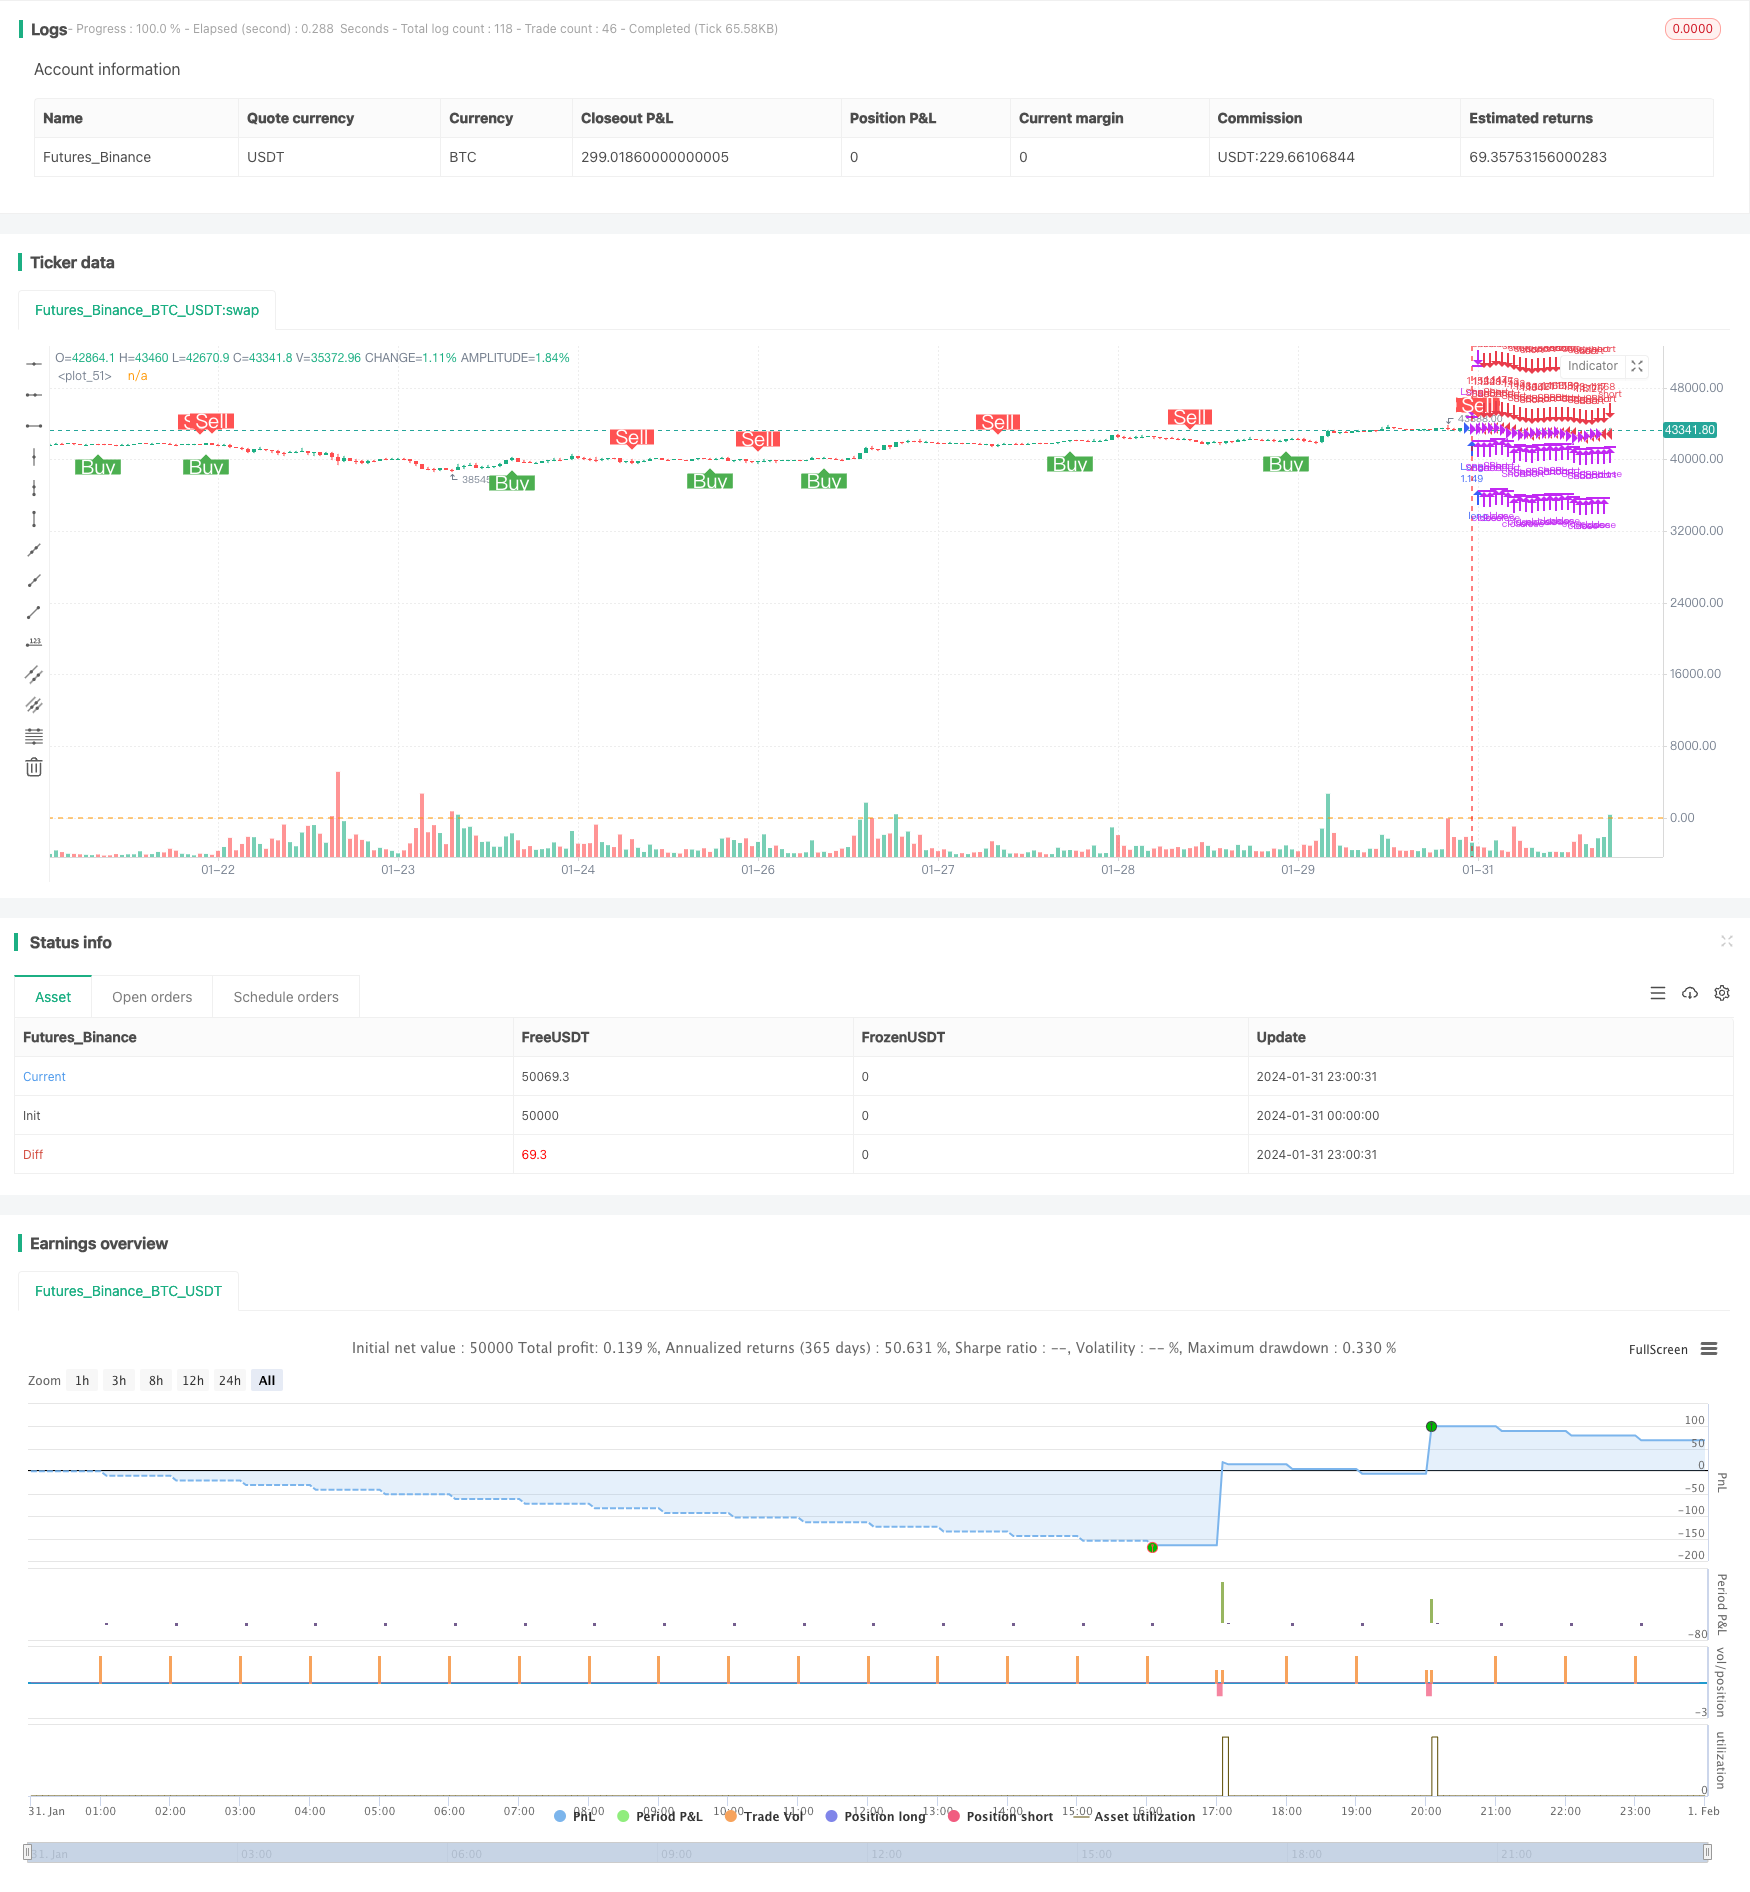
Strategi pengekstrakan momentum beruang lembu adalah strategi perdagangan kuantitatif yang menggabungkan jalur Brin, saluran Keltner, dan indikator momentum. Ia menggunakan jalur Brin dan saluran Keltner untuk menentukan sama ada pasaran semasa berada dalam keadaan pengekstrakan, dan kemudian menggabungkan indikator momentum untuk menghasilkan isyarat perdagangan.
Kelebihan utama strategi ini adalah bahawa ia dapat mengenal pasti secara automatik permulaan kelakuan trend dan menilai masa masuk dengan menggunakan indikator momentum. Tetapi terdapat juga risiko tertentu yang memerlukan pengoptimuman parameter untuk pelbagai jenis.
Prinsip Strategi
Strategi penekanan momentum beruang lembu dinilai berdasarkan tiga petunjuk berikut:
- Bollinger Bands: mengandungi medium, atas dan bawah
- Keltner Channels: mengandungi rel tengah, rel atas dan rel bawah
- Penunjuk Momentum: perbezaan harga semasa dengan harga n hari yang lalu
Apabila Brin mendaki lebih rendah daripada Keltner, dan Brin mendaki lebih tinggi daripada Keltner, kita menganggap pasaran berada dalam keadaan tertekan. Ini biasanya bermakna bahawa tren semasa akan bermula.
Untuk menentukan masa masuk, kami menggunakan indikator momentum untuk menilai kelajuan perubahan harga. Ia menghasilkan isyarat beli apabila momentum naik melampaui nilai purata; ia menghasilkan isyarat jual apabila momentum turun melebihi nilai purata.
Analisis kelebihan strategi
Kelebihan utama strategi pengekstrakan momentum beruang lembu adalah:
- Mengenali trend secara automatik, masuk awal
- Menggabungkan pelbagai petunjuk untuk menilai dan mengelakkan isyarat palsu
- Mengambil trend dan membalikkan kedua-dua cara perdagangan
- Parameter yang boleh disesuaikan untuk mengoptimumkan varieti yang berbeza
Analisis risiko
Ini adalah strategi yang tidak dapat dielakkan, tetapi ia mempunyai risiko:
- Kemungkinan besar isyarat palsu di Brin Belt dan Keltner Channel
- Indeks momentum tidak stabil, mungkin terlepas titik kemasukan terbaik
- Parameter perlu dioptimumkan, jika tidak, ia tidak akan berfungsi
- Kesan lebih berkaitan dengan jenis perdagangan
Untuk mengurangkan risiko, adalah disyorkan untuk mengoptimumkan parameter panjang Brin Belt dan Keltner Channel, menyesuaikan titik berhenti, memilih varieti perdagangan yang lebih cair, dan mengesahkan ia dalam kombinasi dengan petunjuk lain.
Arah pengoptimuman strategi
Untuk meningkatkan lagi keberkesanan strategi pengekstrakan momentum beruang lembu, arah pengoptimuman utama adalah:
- Kombinasi parameter untuk menguji pelbagai varieti dan kitaran
- Optimumkan panjang Brin Belt dan Keltner Channel
- Mengoptimumkan Panjang Indeks Kinerja
- Membuat strategi hentian kerugian yang berbeza untuk multi dan kosong
- Menambah petunjuk lain untuk mengesahkan isyarat
Dengan ujian dan pengoptimuman pelbagai arah, anda boleh meningkatkan peluang kemenangan dan keuntungan strategi ini.
ringkaskan
Strategi pencetakan momentum beruang merangkumi pelbagai penilaian indikator yang kuat, yang dapat mengenal pasti masa permulaan trend. Tetapi ada juga risiko tertentu, yang memerlukan pengoptimuman parameter untuk pelbagai jenis perdagangan. Dengan ujian dan pengoptimuman yang berterusan, strategi ini dapat menjadi sistem perdagangan algoritma yang cekap.
/*backtest
start: 2024-01-31 00:00:00
end: 2024-02-01 00:00:00
period: 1h
basePeriod: 15m
exchanges: [{"eid":"Futures_Binance","currency":"BTC_USDT"}]
*/

//@version=5
// This source code is subject to the terms of the Mozilla Public License 2.0 at https://mozilla.org/MPL/2.0/
// © mtahreemalam original strategy by LazyBear

strategy(title = 'SQM Strategy, TP & SL',
         shorttitle = 'Squeeze.M Strat',
         overlay = true,
         pyramiding = 0,
         default_qty_type = strategy.percent_of_equity,
         default_qty_value = 100,
         initial_capital = 1000,
         commission_type=strategy.commission.percent,
         commission_value=0.0,
         process_orders_on_close=true,
         use_bar_magnifier=true)
//Strategy logic
strategy_logic = input.string("Cross above 0", "Strategy Logic", options = ["LazyBear", "Cross above 0"])

// Date Range
testPeriodSwitch = input(false, "Custom Backtesting Date Range",group="Backtesting Date Range")
i_startTime = input(defval = timestamp("01 Jan 2022 00:01 +0000"), title = "Backtesting Start Time",group="Backtesting Date Range")
i_endTime = input(defval = timestamp("31 Dec 2022 23:59 +0000"), title = "Backtesting End Time",group="Backtesting Date Range")
timeCond = true
isPeriod = testPeriodSwitch == true ? timeCond : true

//// Stoploss and Take Profit Parameters
// Enable Long Strategy
enable_long_strategy = input.bool(true, title='Enable Long Strategy', group='SL/TP For Long Strategy', inline='1')
long_stoploss_value = input.float(defval=5, title='Stoploss %', minval=0.1, group='SL/TP For Long Strategy', inline='2')
long_stoploss_percentage = close * (long_stoploss_value / 100) / syminfo.mintick
long_takeprofit_value = input.float(defval=5, title='Take Profit %', minval=0.1, group='SL/TP For Long Strategy', inline='2')
long_takeprofit_percentage = close * (long_takeprofit_value / 100) / syminfo.mintick

// Enable Short Strategy
enable_short_strategy = input.bool(true, title='Enable Short Strategy', group='SL/TP For Short Strategy', inline='3')
short_stoploss_value = input.float(defval=5, title='Stoploss %', minval=0.1, group='SL/TP For Short Strategy', inline='4')
short_stoploss_percentage = close * (short_stoploss_value / 100) / syminfo.mintick
short_takeprofit_value = input.float(defval=5, title='Take Profit %', minval=0.1, group='SL/TP For Short Strategy', inline='4')
short_takeprofit_percentage = close * (short_takeprofit_value / 100) / syminfo.mintick

//// Inputs
//SQUEEZE MOMENTUM STRATEGY
length = input(20, title='BB Length', group = "Squeeze Momentum Settings")
mult = input(2.0, title='BB MultFactor', group = "Squeeze Momentum Settings")
source = close
lengthKC = input(20, title='KC Length', group = "Squeeze Momentum Settings")
multKC = input(1.5, title='KC MultFactor', group = "Squeeze Momentum Settings")
useTrueRange = input(true, title='Use TrueRange (KC)', group = "Squeeze Momentum Settings")
signalPeriod=input(5, title="Signal Length", group = "Squeeze Momentum Settings")
show_labels_sqm = input(title='Show Buy/Sell SQM Labels', defval=true, group = "Squeeze Momentum Settings")
h0 = hline(0)

// Defining MA
ma = ta.sma(source, length)

// Calculate BB
basis = ma
dev = mult * ta.stdev(source, length)
upperBB = basis + dev
lowerBB = basis - dev

// Calculate KC
range_1 = useTrueRange ? ta.tr : high - low
rangema = ta.sma(range_1, lengthKC)
upperKC = ma + rangema * multKC
lowerKC = ma - rangema * multKC


// SqzON | SqzOFF | noSqz
sqzOn = lowerBB > lowerKC and upperBB < upperKC
sqzOff = lowerBB < lowerKC and upperBB > upperKC
noSqz = sqzOn == false and sqzOff == false

// Momentum
val = ta.linreg(source - math.avg(math.avg(ta.highest(high, lengthKC), ta.lowest(low, lengthKC)), ta.sma(close, lengthKC)), lengthKC, 0)

red_line = ta.sma(val,signalPeriod)
blue_line = val

// lqm = if val > 0
//         if val > nz(val[1])
        // long_sqm_custom
        // if val < nz(val[1])
        // short_sqm_custom
// Plots
//plot(val, style = plot.style_line, title = "blue line", color= color.blue, linewidth=2)
//plot(ta.sma(val,SignalPeriod), style = plot.style_line, title = "red line",color = color.red, linewidth=2)

//plot(val, color=blue, linewidth=2)
//plot(0, color=color.gray, style=plot.style_cross, linewidth=2)
//plot(red_line, color=red, linewidth=2)

//LOGIC
//momentum filter
//filterMom = useMomAverage ? math.abs(val) > MomentumMin / 100000 ? true : false : true
//}

////SQM Long Short Conditions
//Lazy Bear Buy Sell Condition
// long_sqm_lazy = (blue_line>red_line)
// short_sqm_lazy = (blue_line<red_line)

long_sqm_lazy = ta.crossover(blue_line,red_line)
short_sqm_lazy = ta.crossunder(blue_line,red_line)


//Custom Buy Sell Condition
dir_sqm = val < 0 ? -1 : 1
long_sqm_custom = dir_sqm == 1 //and dir_sqm[1] == -1
short_sqm_custom = dir_sqm == -1 //and dir_sqm[1] == 1

long_sqm = strategy_logic == "LazyBear" ? long_sqm_lazy : long_sqm_custom
short_sqm = strategy_logic == "LazyBear" ? short_sqm_lazy : short_sqm_custom


// Plot Stoploss & Take Profit Levels
long_stoploss_price = strategy.position_avg_price * (1 - long_stoploss_value / 100)
long_takeprofit_price = strategy.position_avg_price * (1 + long_takeprofit_value / 100)
short_stoploss_price = strategy.position_avg_price * (1 + short_stoploss_value / 100)
short_takeprofit_price = strategy.position_avg_price * (1 - short_takeprofit_value / 100)
plot(enable_long_strategy and not enable_short_strategy ? long_stoploss_percentage : na, color=color.red, style=plot.style_linebr, linewidth=2, title='Long SL Level')
plot(enable_long_strategy and not enable_short_strategy ? long_takeprofit_percentage : na, color=color.green, style=plot.style_linebr, linewidth=2, title='Long TP Level')
plot(enable_short_strategy and not enable_long_strategy ? short_stoploss_price : na, color=color.red, style=plot.style_linebr, linewidth=2, title='Short SL Level')
plot(enable_short_strategy and not enable_long_strategy ? short_takeprofit_price : na, color=color.green, style=plot.style_linebr, linewidth=2, title='Short TP Level')


// Long Strategy
if long_sqm and enable_long_strategy == true
    strategy.entry('Long', strategy.long)
    strategy.exit('Long  SL/TP', from_entry='Long', loss=long_stoploss_percentage, profit=long_takeprofit_percentage)
    strategy.close('Long', comment = "L. CL")

// Short Strategy
if short_sqm and enable_short_strategy == true
    strategy.entry('Short', strategy.short)
    strategy.exit('Short SL/TP', from_entry='Short', loss=short_stoploss_percentage, profit=short_takeprofit_percentage)
    strategy.close('Short', comment = "S.Cl")

plot_sqm_long = long_sqm and not long_sqm[1]
plot_sqm_short = short_sqm and not short_sqm[1]

plotshape(plot_sqm_long and show_labels_sqm, title='Buy', style=shape.labelup, location=location.belowbar, size=size.normal, text='Buy', textcolor=color.new(color.white, 0), color=color.new(color.green, 0))
plotshape(plot_sqm_short and show_labels_sqm, title='Sell', style=shape.labeldown, location=location.abovebar, size=size.normal, text='Sell', textcolor=color.new(color.white, 0), color=color.new(color.red, 0))

// Date Range EXIT
if (not isPeriod)
    strategy.cancel_all()
    strategy.close_all()