Strategi Pengujian Balik Talian Sambungan Harga Masa Depan
Gambaran keseluruhan
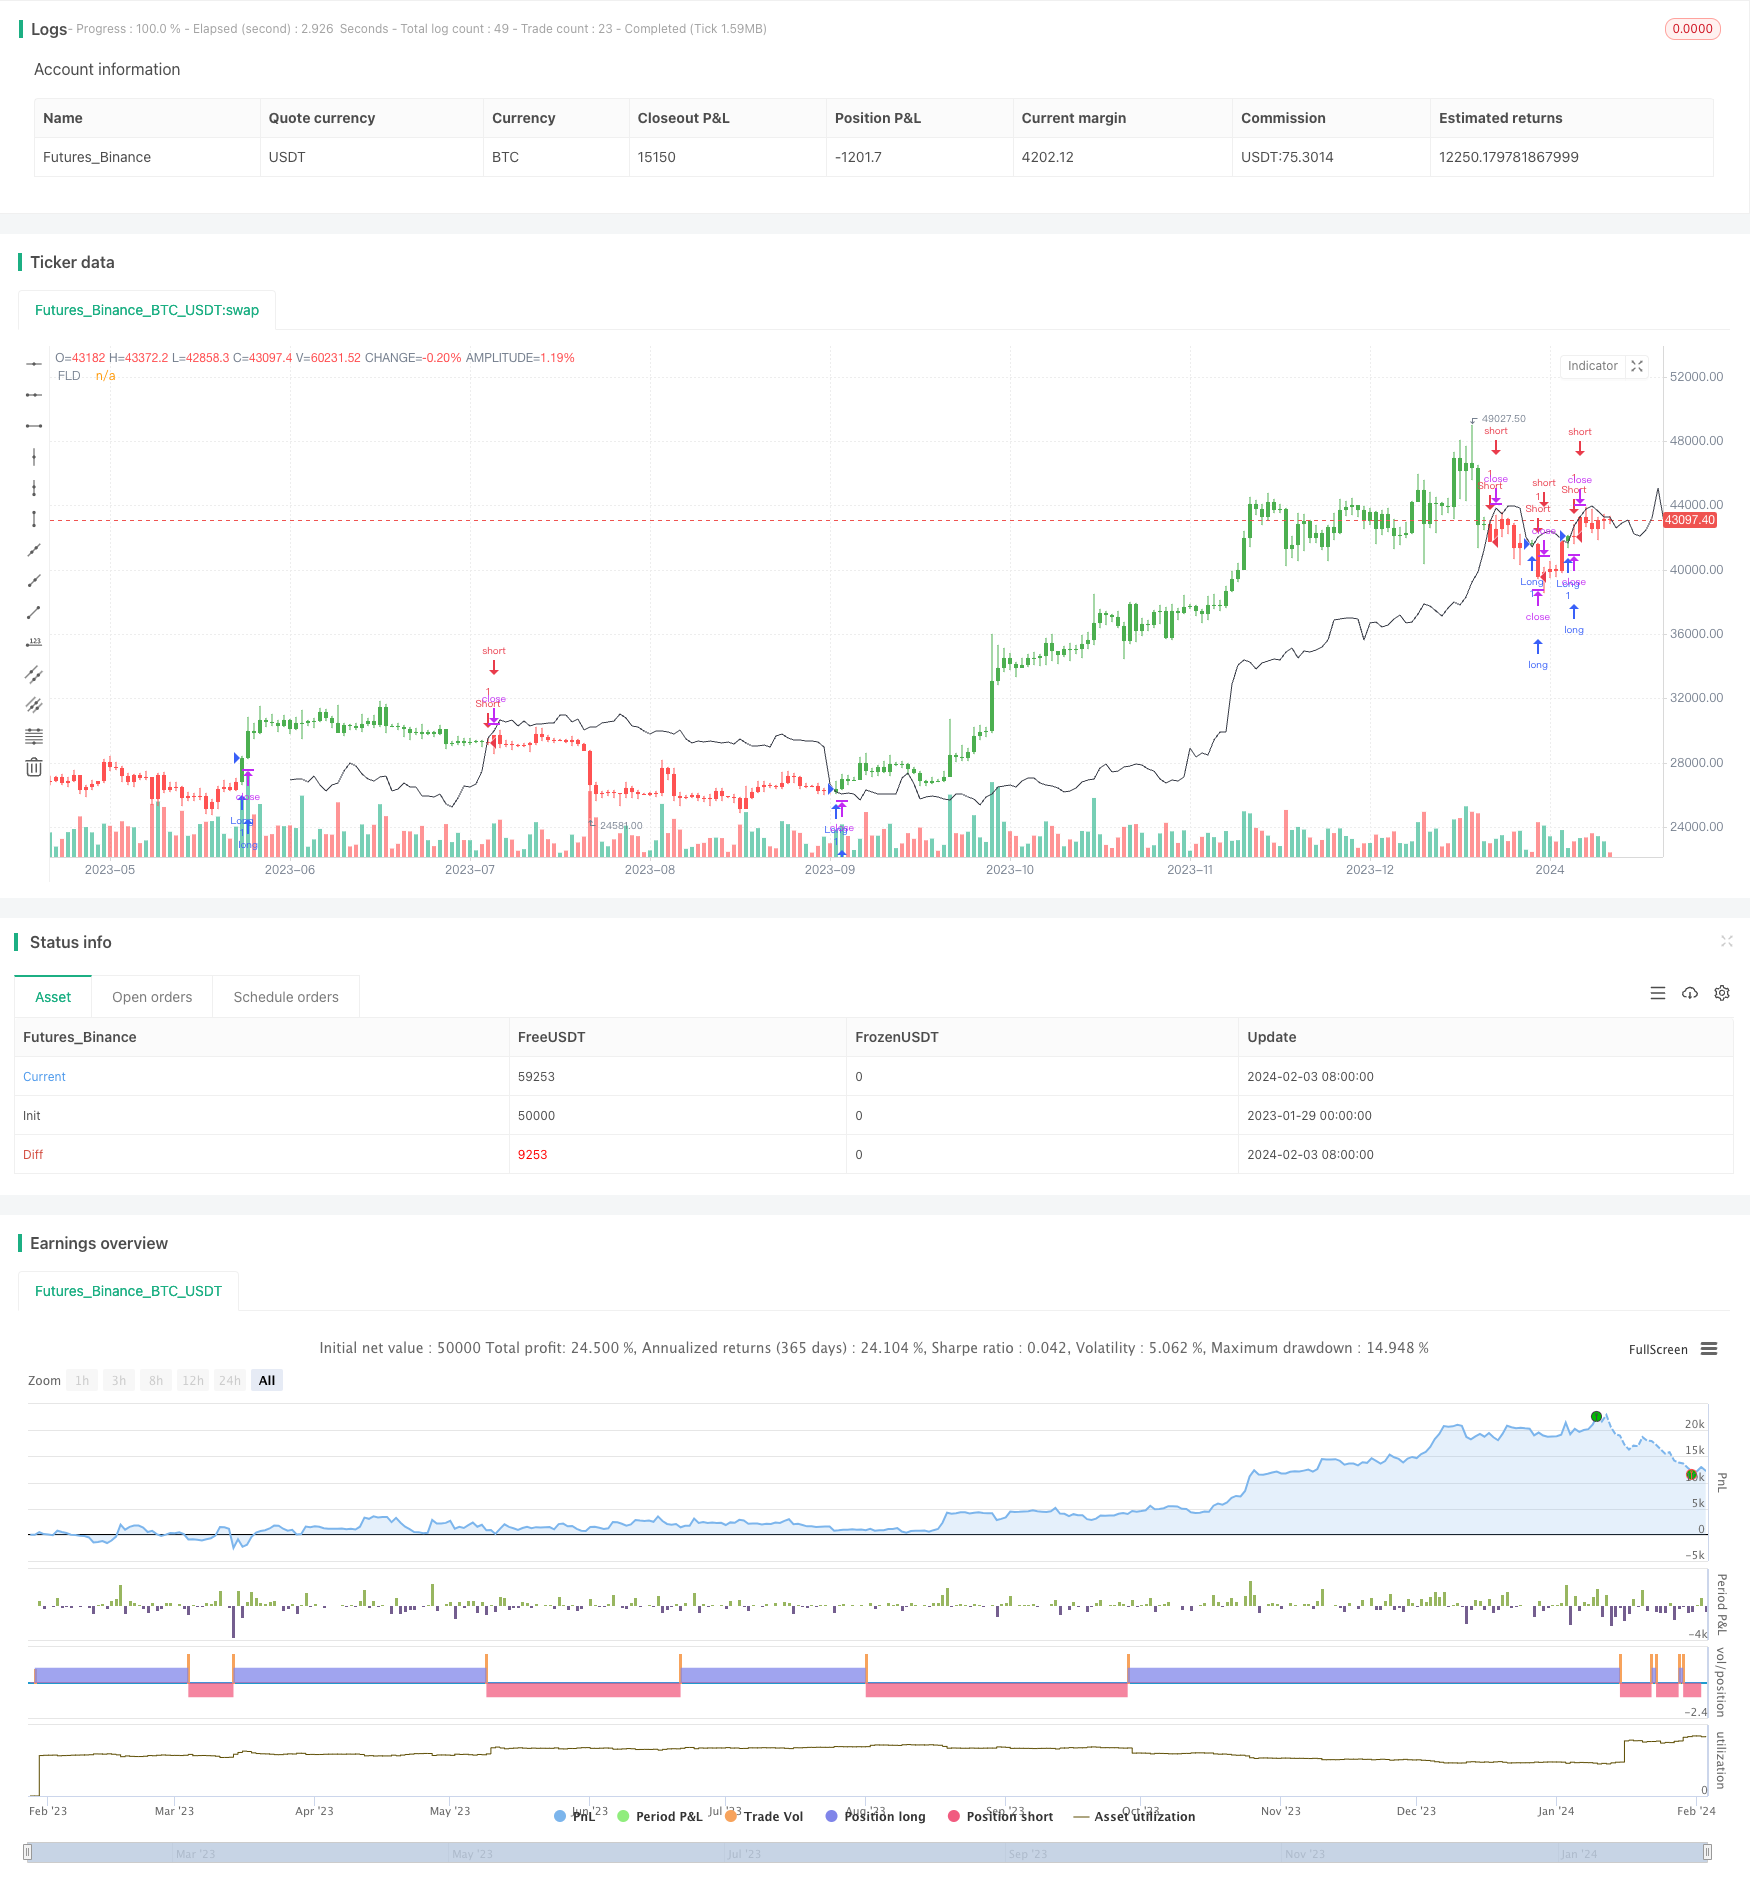
Idea utama strategi ini adalah untuk menentukan arah harga masa depan dengan menggambar garis lanjutan harga masa depan, dan menggabungkan hubungan harga semasa dengan garis tersebut. Apabila harga lebih tinggi atau lebih rendah daripada garis lanjutan, anda boleh melakukan lebih banyak atau kurang.
Prinsip Strategi
Garis lanjutan harga masa depan (Future Lines of Demarcation, FLD) mewakili harga pertengahan, harga tertinggi atau harga terendah dalam tempoh masa depan tertentu. Strategi ini menggunakan FLD untuk menentukan pergerakan harga masa depan, prinsipnya adalah:
- Berdasarkan panjang kitaran, kitaran pergerakan FLD dikira Period, iaitu harga masa depan Price.
- Bandingkan harga Tutup semasa dengan harga selepas tempoh pemindahan FLD.
- Apabila harga tutup lebih rendah daripada harga masa depan FLD, ia dianggap sebagai isyarat bullish.
- Apabila harga tutup lebih tinggi daripada harga masa depan FLD, ia dianggap sebagai isyarat penurunan.
- Berdasarkan isyarat kenaikan dan penurunan harga, lakukanlah operasi tambahan yang sesuai.
Analisis kelebihan
Strategi ini mempunyai kelebihan utama:
- Penggunaan FLD untuk menentukan pergerakan harga masa depan mempunyai ketepatan yang lebih tinggi.
- Parameter kitaran yang boleh disesuaikan untuk persekitaran pasaran yang berbeza.
- Anda boleh memilih harga pertengahan, harga tertinggi atau harga terendah sebagai sumber penggambaran FLD, dan ia sangat mudah disesuaikan.
Analisis risiko
Risiko utama strategi ini ialah:
- FLD sendiri mungkin gagal, menyebabkan kehilangan peluang atau isyarat yang salah. Ia boleh digabungkan dengan petunjuk lain.
- Tetapan parameter kitaran yang tidak betul boleh menyebabkan terlalu banyak isyarat salah. Perlu mengoptimumkan panjang kitaran.
- Kejadian tiba-tiba menyebabkan harga turun naik secara mendadak, dan FLD tidak dapat membuat ramalan. Anda boleh menetapkan stop loss untuk mengawal risiko.
Arah pengoptimuman
Strategi ini boleh dioptimumkan dengan:
- Gabungan dengan isyarat penapisan indikator lain, meningkatkan ketepatan strategi. Seperti MACD, KDJ dan sebagainya.
- Mengoptimumkan parameter kitaran untuk mencari kombinasi parameter terbaik.
- Menambah mekanisme penangguhan kerugian dan mengawal kerugian dan keuntungan tunggal.
- Berdasarkan hasil pengesanan semula, atur peraturan lebih banyak ruang kosong untuk mengurangkan isyarat yang salah.
ringkaskan
Strategi ini adalah strategi trend-following yang tipikal dengan membandingkan harga dengan garis lanjutan harga masa depan selepas perpindahan, untuk menentukan arah pergerakan harga masa depan. Secara keseluruhan, logiknya jelas dan mudah difahami, pelaksanaan risiko lebih rendah.
/*backtest
start: 2023-01-29 00:00:00
end: 2024-02-04 00:00:00
period: 1d
basePeriod: 1h
exchanges: [{"eid":"Futures_Binance","currency":"BTC_USDT"}]
*/

//@version=2
////////////////////////////////////////////////////////////////////
//  Copyright by HPotter v1.0 15/02/2017
//  An FLD is a line that is plotted on the same scale as the price and is in fact the
//  price itself displaced to the right (into the future) by (approximately) half the
//  wavelength of the cycle for which the FLD is plotted. There are three FLD's that can be
//  plotted for each cycle:
//    An FLD based on the median price.
//    An FLD based on the high price.
//    An FLD based on the low price.
///////////////////////////////////////////////////////////////////
strategy(title="FLD's - Future Lines of Demarcation", overlay=true)
Period = input(title="Period", defval=40)
src = input(title="Source", defval=hl2)
reverse = input(false, title="Trade reverse")
FLD = src
pos = iff(FLD[Period] < close , 1,
       iff(FLD[Period] > close, -1, nz(pos[1], 0)))
possig = iff(reverse and pos == 1, -1,
         iff(reverse and pos == -1, 1, pos))
if (possig == 1)
    strategy.entry("Long", strategy.long)
if (possig == -1)
    strategy.entry("Short", strategy.short)
barcolor(possig == -1 ? red: possig == 1 ? green : blue)
plot(FLD, title="FLD", style=line, linewidth=1, color=black, offset = Period)