Strategi Perdagangan Garis Aliran Cerun Dinamik
Gambaran keseluruhan
Idea teras strategi ini adalah menggunakan kemerosotan dinamik untuk menentukan arah trend harga dan menghasilkan isyarat perdagangan yang digabungkan dengan keputusan pemecahan. Khususnya, ia akan menjejaki harga tinggi dan rendah baru dalam masa nyata, mengira kemerosotan dinamik berdasarkan perubahan harga dalam tempoh masa yang berbeza, dan kemudian menilai penembusan harga terhadap garis trend. isyarat kosong.
Prinsip Strategi
Strategi ini terdiri daripada beberapa langkah utama:
Menentukan harga tertinggi dan terendah: mengesan harga tertinggi dan terendah dalam tempoh tertentu (seperti 20 garis K) untuk menentukan sama ada tinggi atau rendah yang baru
Mengira kemerosotan dinamik: Nomborkan K baris yang merekodkan kemerosotan atau kemerosotan baharu, mengira kemerosotan dinamik dari kemerosotan ke kemerosotan selepas tempoh tertentu (seperti 9 baris K)
Merangka garis trend: Merangka garis trend naik dan turun mengikut kemerosotan dinamik
Lini trend diperpanjang dan diperbaharui: Lini trend diperpanjang dan diperbaharui apabila harga melepasi garis trend
Isyarat dagangan: merangkumi penembusan harga pada garisan trend, keputusan untuk melakukan lebih banyak dan isyarat untuk melakukan lebih sedikit
Kelebihan Strategik
Strategi ini mempunyai kelebihan berikut:
Bergerak dalam menilai arah trend, fleksibel dalam menangani perubahan pasaran
Dapat mengawal kerugian berhenti, penarikan balik
Sinyal penembusan perdagangan jelas dan mudah dilaksanakan
Parameter yang boleh disesuaikan, beradaptasi
Struktur kod jelas, mudah difahami dan digunakan semula
Risiko dan Penyelesaian
Strategi ini juga mempunyai risiko:
Ia adalah satu-satunya cara untuk menjimatkan wang anda.
Isyarat palsu mungkin lebih banyak, parameter boleh disesuaikan atau syarat penapisan ditambah
Risiko Hentikan Kerosakan Apabila Keadaan Berubah
Ruang optimasi terhad, keuntungan terhad, sesuai untuk perdagangan garis pendek
Arah pengoptimuman
Kaedah ini boleh dioptimumkan di antara lain:
Tambah lebih banyak petunjuk teknikal untuk menilai isyarat penapisan
Mengoptimumkan kombinasi parameter untuk mencari parameter terbaik
Mencuba meningkatkan strategi berhenti kerugian dan mengurangkan risiko
Tambah fungsi untuk menyesuaikan amplitud input secara automatik
Cuba untuk mencari peluang dengan menggabungkan strategi lain.
ringkaskan
Strategi ini secara keseluruhannya adalah strategi garis pendek yang cekap yang berdasarkan trend penilaian kecenderungan dinamik dan memecahkan perdagangan. Ia menilai dengan tepat, risiko terkawal, sesuai untuk menangkap peluang garis pendek di pasaran. Dengan mengoptimumkan parameter lebih lanjut dan menambahkan syarat penapisan, anda boleh meningkatkan kemenangan strategi dan tahap keuntungan.
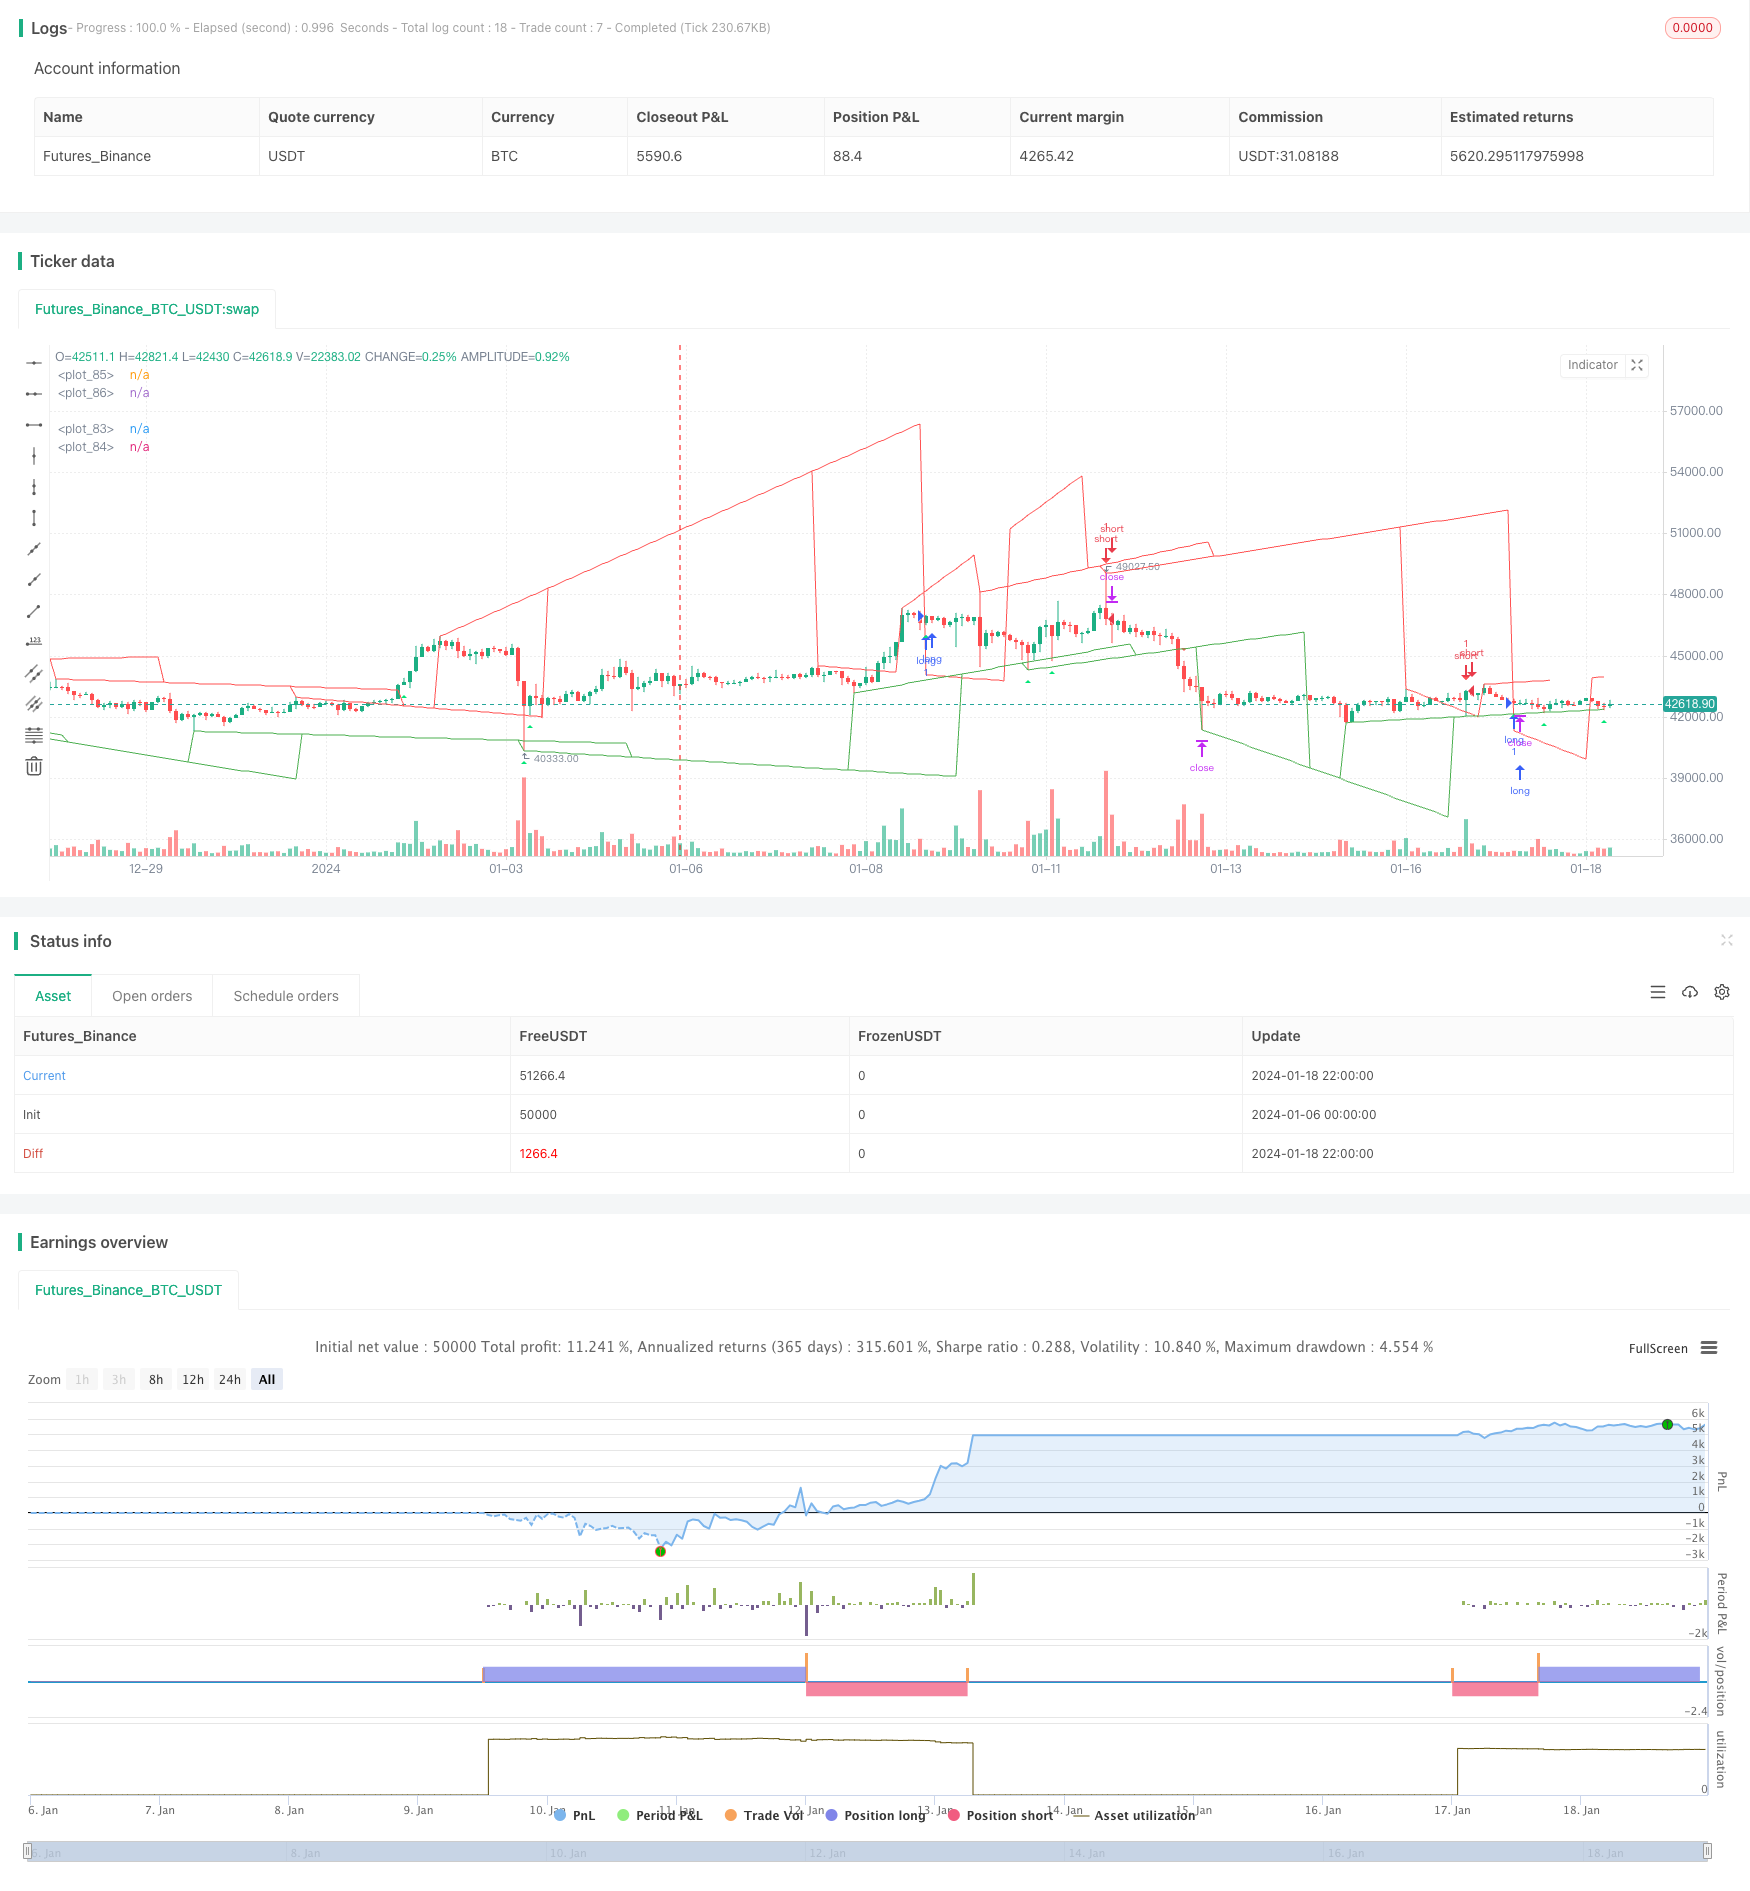
/*backtest
start: 2024-01-06 00:00:00
end: 2024-01-19 00:00:00
period: 2h
basePeriod: 15m
exchanges: [{"eid":"Futures_Binance","currency":"BTC_USDT"}]
*/

// This source code is subject to the terms of the Mozilla Public License 2.0 at https://mozilla.org/MPL/2.0/
// © pune3tghai

//Originally posted by matsu_bitmex

//tried adding alerts on plots and cleared the chart for a cleaner view.
//Publishing the script in hope of getting it improved by someone else.

//Added strategy code for easier calculations

//Needs work on TP and SL part.

//P.S - THE ORIGINAL CODE IS MUCH BETTER BUT I have tried to be more usable and understandable.

//@version=4
strategy("TrendLines with Alerts", overlay=true)     //study("TrendLines with Alerts", overlay=true)
//update

length1 = input(20)
check = input(9)
//length2 = input(200)


u=0.0
u := u[1]

l=0.0
l := l[1]

y=0.0
y := y[1]

yl=0.0
yl := yl[1]

angle = 0.0
angle := angle[1]

anglel = 0.0
anglel := anglel[1]

if (highest(length1) == high[check] and highest(length1) == highest(length1)[check] and barssince(barstate.isfirst) > check)
    u := high[check]


if (lowest(length1) == low[check] and lowest(length1) == lowest(length1)[check] and barssince(barstate.isfirst) > check)
    l := low[check]


p = round(barssince(u == high[check]))

pl = round(barssince(l == low[check]))

if p == 0 and barssince(barstate.isfirst) > check
    y := high[abs(p[1]+1+check)]

if pl == 0 and barssince(barstate.isfirst) > check
    yl := low[abs(pl[1]+1+check)]


if p == 0
    angle := (u-y)/p[1]

if pl == 0
    anglel := (l-yl)/pl[1]

uppertrend = u+ (p * angle)

lowertrend = l+ (pl * anglel)

extendup = if barssince(barstate.isfirst) > check
    uppertrend[check] + angle[check] * check*2

extenddown = if barssince(barstate.isfirst) > check
    lowertrend[check] + anglel[check] * check*2


//plot(l[offset]-u,color=red)
//plot(u[offset]-l,color = green )
plot(lowertrend, color = color.green, transp=30,offset = -check)
plot(extenddown, color = color.green, transp=100)
plot(uppertrend, color = color.red, transp=30, offset = -check)
plot(extendup, color = color.red, transp=100)
//plot(l[offset], color = red)

l1 = lowertrend
l2 = extenddown
u1 = uppertrend
u2 = extendup


l2sell = crossunder(high, l2)
u2buy = crossover(low, u2)
buy1 = (low<=lowertrend) and open>lowertrend and high>lowertrend and close>lowertrend
buy2 = (low<=extenddown) and open>extenddown and high>extenddown and close>extenddown
buy = buy1 or buy2 or u2buy
plotshape(series=buy, title="Buy", style=shape.triangleup, size=size.tiny, color=color.lime, location=location.belowbar)
sell1 = (high>=uppertrend) and open<uppertrend and low<uppertrend and close<uppertrend
sell2 = (high>=extendup) and open<extendup and low<extendup and close<extendup
sell = sell1 or sell2 or l2sell
plotshape(series=sell, title="Sell", style=shape.triangledown, size=size.tiny, color=color.red, location=location.abovebar)

longCond = buy
shortCond = sell

tp = input(0.2, title="Take Profit")

tpbuyval = valuewhen(buy, close, 1) + (tp/100)*(valuewhen(buy, close, 1))
tpsellval = valuewhen(sell, close, 1) - (tp/100)*(valuewhen(sell, close, 1))


sl = input(0.2, title="Stop Loss")
slbuyval = valuewhen(buy, close, 0) - (sl/100)*(valuewhen(buy, close, 0))
slsellval = valuewhen(sell, close, 0) + (sl/100)*(valuewhen(sell, close, 0))
// === STRATEGY ===
tradeType = input("BOTH", title="What trades should be taken : ", options=["LONG", "SHORT", "BOTH", "NONE"])

// stop loss
slPoints = input(defval=0, title="Initial Stop Loss Points (zero to disable)", minval=0)
tpPoints = input(defval=0, title="Initial Target Profit Points (zero for disable)", minval=0)

//>>>>>>>>>>>>>>>>>>>>>>>>>>>>>>>>>>>>>>>>>>>>>>>>>>>>>>>>>>>>>>>>>>>>>>>>>>>>>//

testStartYear = input(2019, "Backtest Start Year", minval=1980)
testStartMonth = input(1, "Backtest Start Month", minval=1, maxval=12)
testStartDay = input(1, "Backtest Start Day", minval=1, maxval=31)
testPeriodStart = timestamp(testStartYear, testStartMonth, testStartDay, 0, 0)

testStopYear = input(9999, "Backtest Stop Year", minval=1980)
testStopMonth = input(12, "Backtest Stop Month", minval=1, maxval=12)
testStopDay = input(31, "Backtest Stop Day", minval=1, maxval=31)
testPeriodStop = timestamp(testStopYear, testStopMonth, testStopDay, 0, 0)

testPeriod() =>
    time >= testPeriodStart and time <= testPeriodStop ? true : false

//<<<<<<<<<<<<<<<<<<<<<<<<<<<<<<<<<<<<<<<<<<<<<<<<<<<<<<<<<<<<<<<<<<<<<<<<<<<<<//

//
//set up exit parameters
TP = tpPoints > 0 ? tpPoints : na
SL = slPoints > 0 ? slPoints : na

// Make sure we are within the bar range, Set up entries and exit conditions
if testPeriod() and tradeType != "NONE"
    strategy.entry("long", strategy.long, when=longCond == true and tradeType != "SHORT")
    strategy.entry("short", strategy.short, when=shortCond == true and tradeType != "LONG")
    strategy.close("long", when=shortCond == true and tradeType == "LONG")
    strategy.close("short", when=longCond == true and tradeType == "SHORT")
    strategy.exit("XL", from_entry="long", profit=tpbuyval, loss=slbuyval)
    strategy.exit("XS", from_entry="short", profit=tpsellval, loss=slsellval)

// === /STRATEGY ===
//EOF


////ALERT SYNTEX
//alertcondition(longCond, title="Long", message="Killer Market")
//alertcondition(shortCond, title="Short", message="Poopy Market")