Strategi penghakiman arah aliran dinamik MACD berdasarkan purata bergerak

1
Follow
1782
Followers
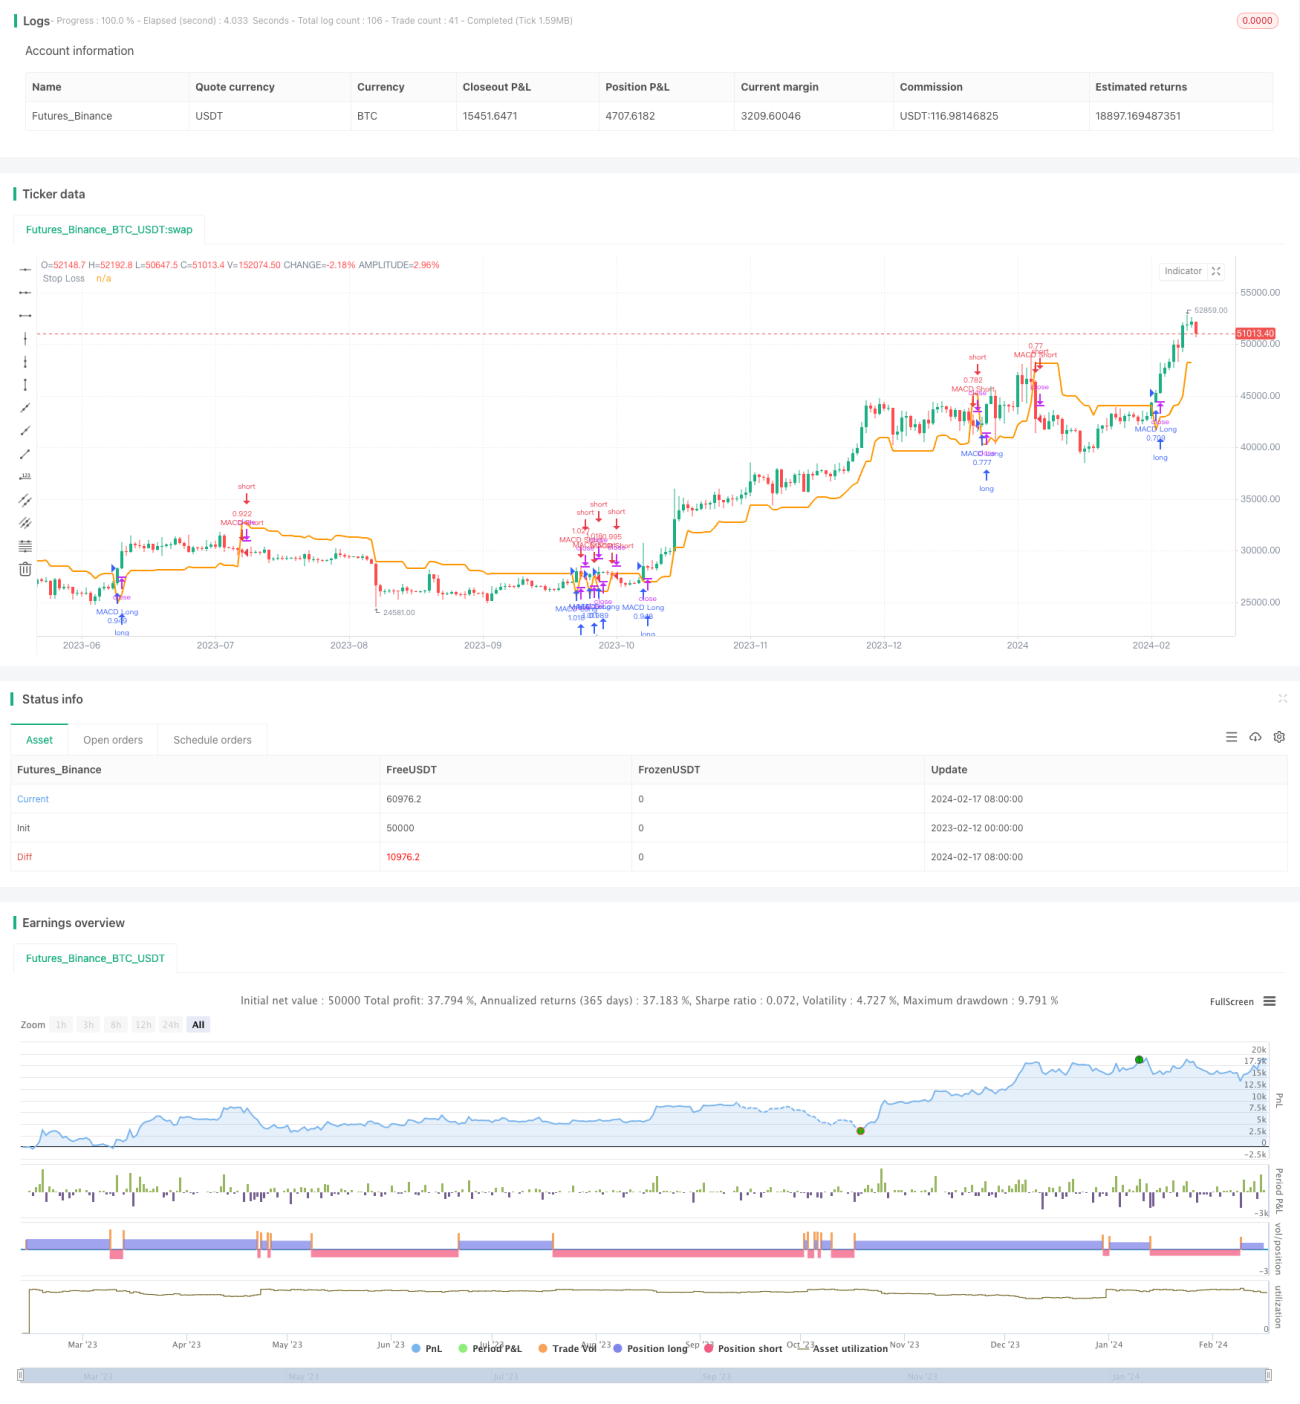
Gambaran keseluruhan
Strategi ini berdasarkan kombinasi garis rata dari penunjuk MACD, untuk menilai trend dinamik sepanjang tempoh masa, dan merupakan strategi penjejakan trend yang lebih klasik. Terutama melalui perbezaan garis rata yang cepat dan perlahan MACD dan hubungan garis isyaratnya, untuk menilai arah dan kekuatan trend semasa.
Prinsip Strategi
- Arah trend semasa berdasarkan perbezaan garis rata-rata MACD dan hubungan garis isyaratnya
- MACD perbezaan di atas melalui garis isyarat untuk melakukan isyarat banyak, di bawah melalui isyarat kosong
- Memperkenalkan perbezaan MACD dan MACD columnar isosceles untuk meningkatkan isyarat strategi
- Menambah modul penghakiman antara kitaran, mengambil indikator MACD kitaran masa yang lebih tinggi sebagai asas penyesuaian gelombang isyarat dan kedudukan
- Penyesuaian kedudukan dinamik, mengurangkan saiz kedudukan apabila isyarat melangkaui kitaran lemah, meningkatkan kedudukan apabila isyarat meningkat
Analisis kelebihan
- Indeks MACD sendiri lebih berkesan dalam menentukan arah trend
- Kombinasi perbezaan MACD dan dua kali pengesahan barisan tiang dapat meningkatkan ketepatan isyarat
- Penghakiman melangkaui kitaran meningkatkan kestabilan strategi dan mengelakkan isyarat frekuensi tinggi yang salah
- Pembaikan kedudukan yang dinamik menjadikan strategi lebih baik untuk merebut peluang dan meningkatkan keuntungan yang berlebihan
Analisis risiko dan penyelesaian
- Sinyal MACD mengalami kelewatan dan mungkin menyebabkan kesan yang kurang baik
- Penyelesaiannya: Tambah laju rata-rata dan laju rata-rata untuk menangkap isyarat lebih awal
- Isyarat lintas kitaran tidak semestinya tepat dan boleh mengelirukan strategi
- Penyelesaian: Memperkenalkan mekanisme penyesuaian kedudukan yang dinamik, menjadikan strategi kitaran utama dominan
- Strategi gabungan pelbagai faktor mungkin kurang stabil secara keseluruhan
- Penyelesaian: Menyesuaikan parameter-parameter strategi dengan teliti bagi memastikan kesejahteraan keseluruhan
Arah pengoptimuman
- Uji keserasian kombinasi parameter kitaran yang berbeza
- Uji kesan gabungan pelbagai kitaran terhadap kesan strategi
- Sesuaikan parameter penunjuk MACD, seperti kitaran garis rata-rata perlahan, kitaran garis isyarat, dan lain-lain
- Uji Kesan Faktor Pengaturan Pelbagai Posisi
- Ujian tindak balas pada varieti lain
ringkaskan
MACD ini menggabungkan strategi trend dinamik melintasi kitaran, menggabungkan keunggulan penilaian indikator klasik dan rujukan pelbagai kerangka masa. Dengan pengoptimuman parameter dan ujian gabungan, anda boleh membina strategi trend yang lebih stabil dan menguntungkan.
Source
Pine
Strategy parameters
Related strategies
Comment
All comments (0)
No data
- 1