Strategi kuantitatif berdasarkan pembalikan titik pangsi
Gambaran keseluruhan
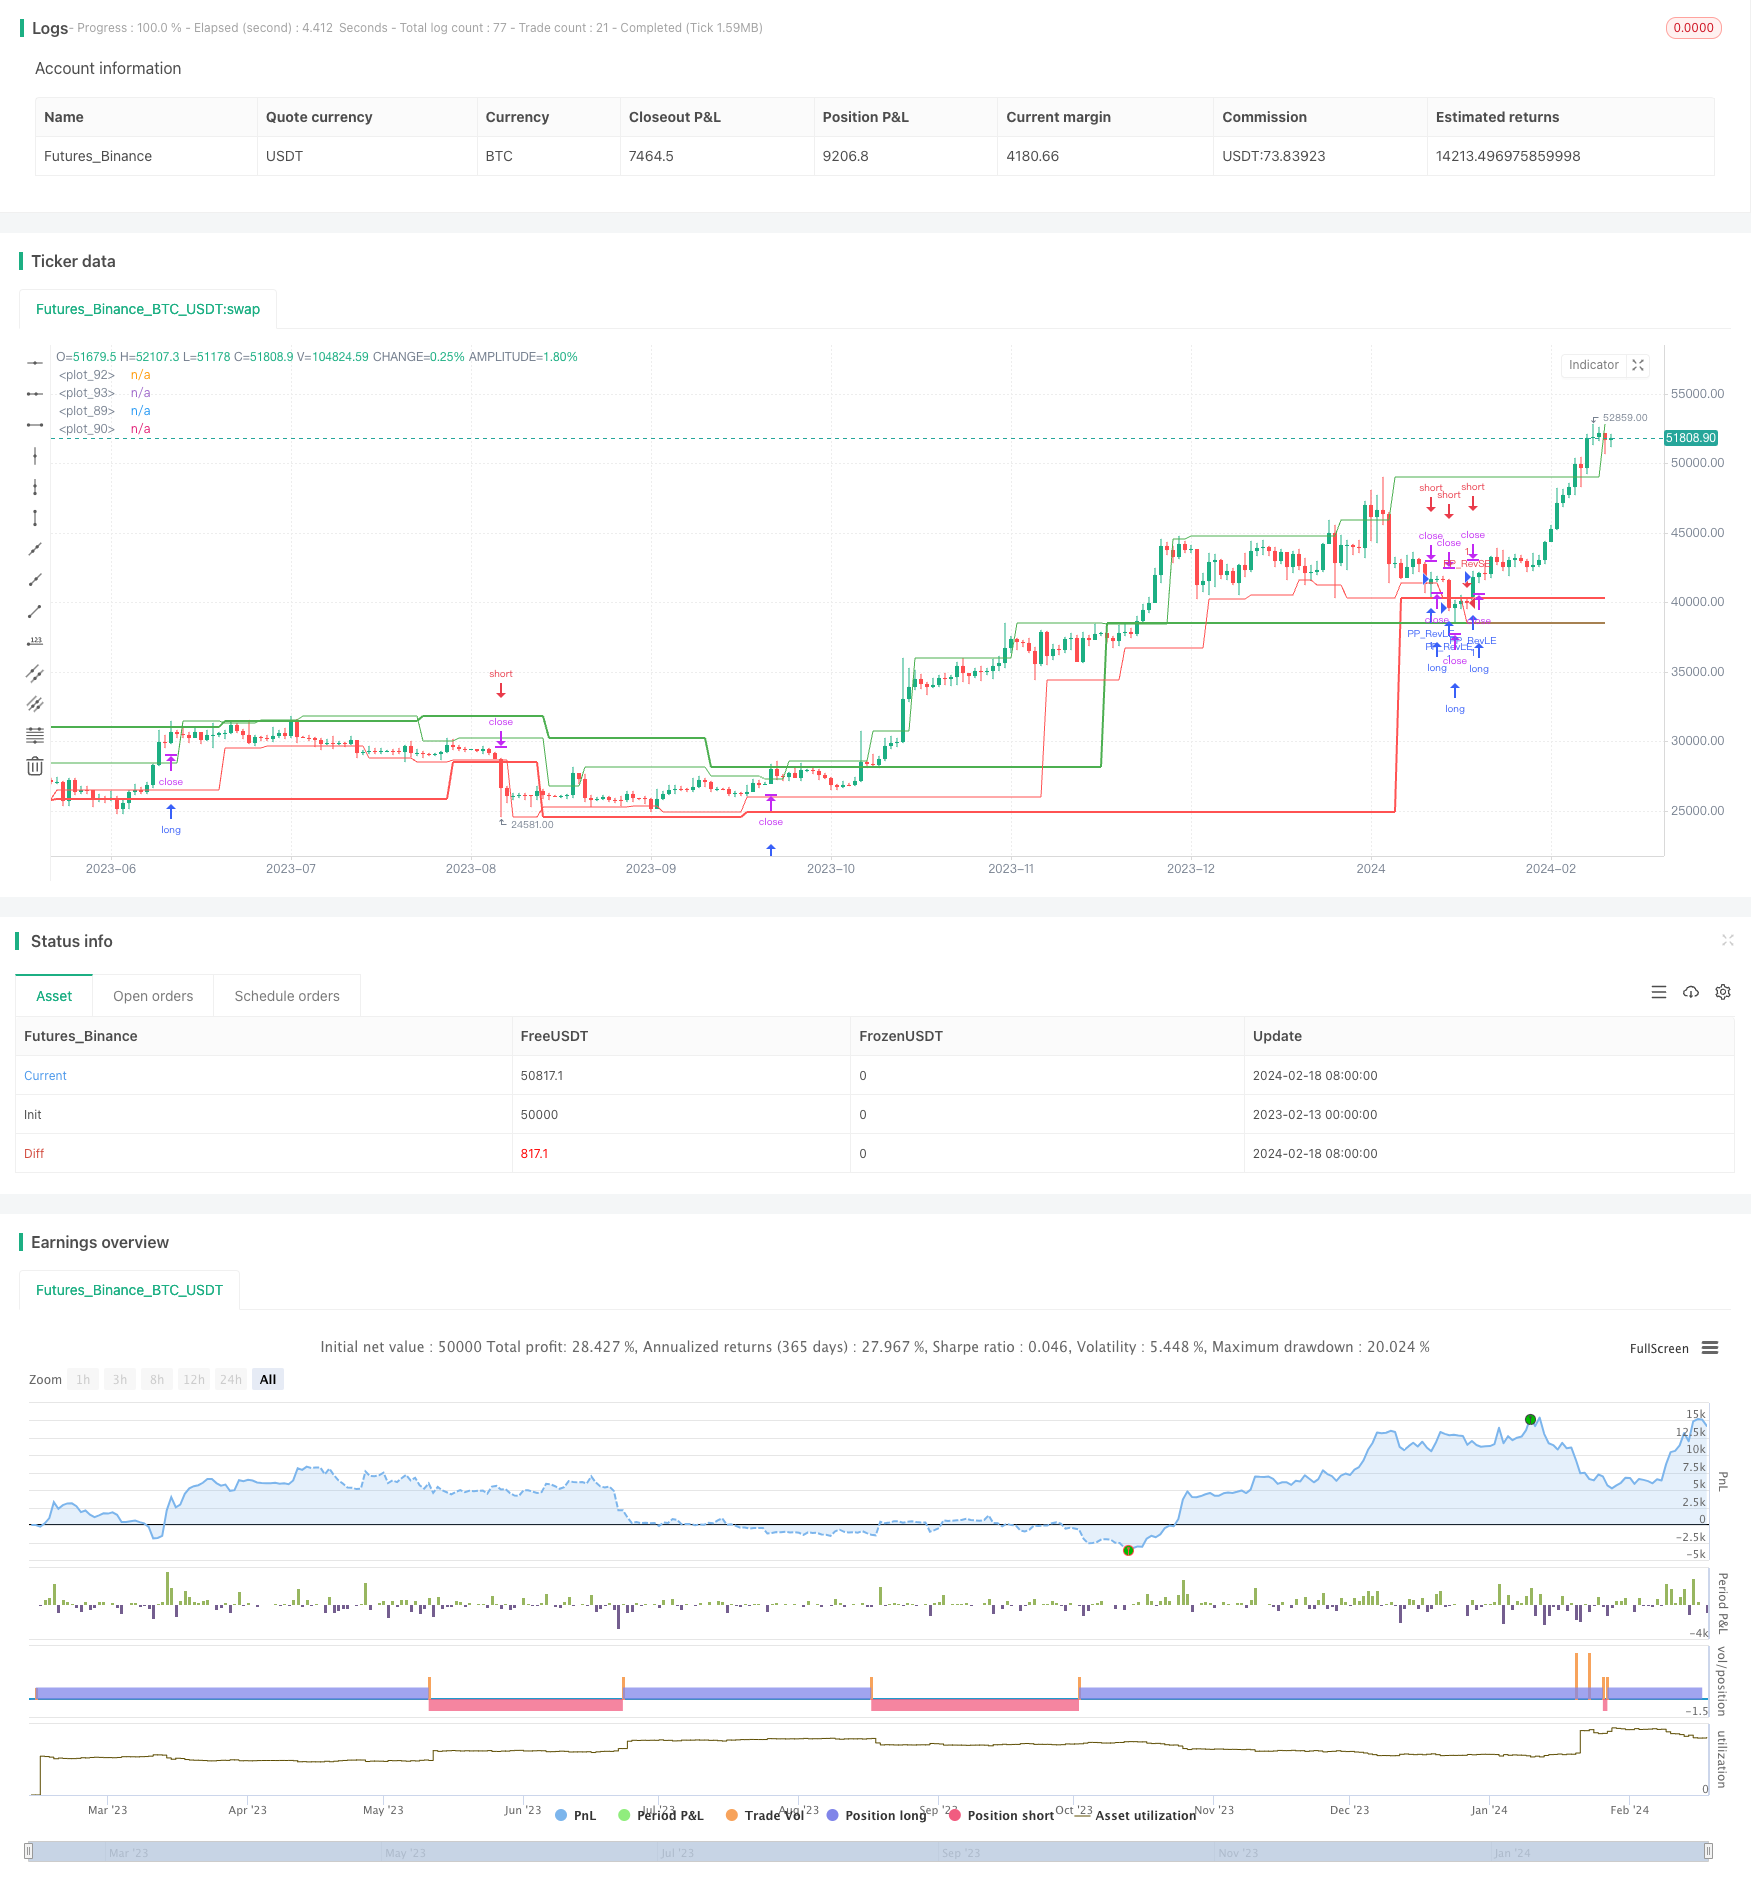
Idea teras strategi ini adalah untuk melakukan perdagangan kuantitatif menggunakan titik-titik utama. Ia mencari titik-titik tinggi dan rendah yang penting dan melakukan perdagangan terbalik apabila harga menembusi titik-titik penting ini.
Prinsip Strategi
Strategi ini mula-mula menentukan fungsi pivotHighSig() dan pivotLowSig() untuk mencari titik-titik tinggi dan rendah pada sumbu pusat. Kedua-dua fungsi ini akan mencari titik-titik pusat yang sesuai di sebelah kiri dan kanan.
Khususnya, untuk titik-titik tinggi pada sumbu, ia akan mencari beberapa titik-titik tinggi yang lebih tinggi secara berturut-turut di sebelah kiri dan mencari beberapa titik-titik tinggi yang lebih rendah secara berturut-turut di sebelah kanan. Dengan demikian, titik-titik tinggi pada sumbu berada di kedudukan yang lebih tinggi secara relatif.
Selepas mencari titik tinggi dan rendah, strategi akan memilih titik penting dalam titik pusat. Ini dilakukan dengan menentukan beberapa pembolehubah sejarah titik tinggi dan rendah seperti ph1, ph2 dan sebagainya.
Akhirnya, apabila harga menembusi titik-titik pusat, maka perdagangan berbalik akan dilakukan.
Kelebihan Strategik
Strategi kuantitatif berdasarkan titik pusat ini mempunyai beberapa kelebihan:
- Mengambil kesempatan daripada kawasan sokongan dan rintangan di pasaran, yang sering menjadi titik peluang untuk membalikkan harga
- Dalam pada itu, mencari titik tinggi dan titik rendah yang penting untuk mencapai perdagangan dua hala dengan pelbagai ruang.
- Titik pusat adalah titik extremum yang lebih menonjol, titik seperti ini mempunyai isyarat yang lebih kuat
- Menggunakan titik-titik pusat pada sumbu untuk menjadikan isyarat lebih dipercayai
Risiko dan Penyelesaian
Strategi ini mempunyai beberapa risiko:
- Kesalahan pengiktirafan titik pusat, menyebabkan isyarat yang salah. Penyelesaian adalah dengan menyesuaikan parameter jarak kiri dan kanan untuk memastikan pengiktirafan titik pusat lebih tepat.
- Penembusan palsu. Penyelesaian adalah dengan menggabungkan lebih banyak faktor penapisan isyarat, seperti tenaga kuantitatif, jumlah transaksi, dan sebagainya.
Arah pengoptimuman
Strategi ini juga boleh dioptimumkan dalam beberapa arah:
- Menambah strategi henti kerugian untuk menjadikan strategi lebih stabil
- Menapis isyarat dengan lebih banyak petunjuk
- Membangunkan strategi PRED terbalik untuk mengoptimumkan lebih lanjut ramalan pivotal menggunakan ML
- Tambah fungsi penyesuaian parameter
ringkaskan
Strategi ini secara keseluruhan berkinerja baik, idea utamanya adalah untuk mencari titik-titik penting dan melakukan perdagangan terbalik apabila ia pecah. Dengan pengoptimuman lanjut, strategi ini dapat memperoleh isyarat yang lebih stabil dan boleh dipercayai, yang akan menghasilkan keuntungan yang baik.
/*backtest
start: 2023-02-13 00:00:00
end: 2024-02-19 00:00:00
period: 1d
basePeriod: 1h
exchanges: [{"eid":"Futures_Binance","currency":"BTC_USDT"}]
*/

//@version=4
strategy("Pivot of Pivot Reversal Strategy [QuantNomad]", shorttitle = "PoP Reversal Strategy [QN]", overlay=true)

// Inputs
leftBars   = input(4,   title = 'PP Left Bars')
rightBars  = input(2,   title = 'PP Right Bars')
atr_length = input(14,  title = 'ATR Length')
atr_mult   = input(0.1, title = 'ATR Mult')

// Pivot High Significant Function
pivotHighSig(left, right) =>
    pp_ok = true
    atr   = atr(atr_length)

    for i = 1 to left
        if (high[right] < high[right+i] + atr * atr_mult)
            pp_ok := false
    for i = 0 to right-1
        if (high[right] < high[i] + atr * atr_mult)
            pp_ok := false

    pp_ok ? high[right] : na

// Pivot Low Significant Function
pivotLowSig(left, right) =>
    pp_ok = true
    atr   = atr(atr_length)

    for i = 1 to left
        if (low[right] > low[right+i] - atr * atr_mult)
            pp_ok := false
    for i = 0 to right-1
        if (low[right] > low[i] - atr * atr_mult)
            pp_ok := false

    pp_ok ? low[right] : na


swh = pivotHighSig(leftBars, rightBars)
swl = pivotLowSig (leftBars, rightBars)

swh_cond = not na(swh)

hprice = 0.0
hprice := swh_cond ? swh : hprice[1]

le = false
le := swh_cond ? true : (le[1] and high > hprice ? false : le[1])

swl_cond = not na(swl)

lprice = 0.0
lprice := swl_cond ? swl : lprice[1]

se = false
se := swl_cond ? true : (se[1] and low < lprice ? false : se[1])

// Pivots of pivots
ph1 = 0.0
ph2 = 0.0
ph3 = 0.0

pl1 = 0.0
pl2 = 0.0
pl3 = 0.0

pphprice = 0.0
pplprice = 0.0

ph3 := swh_cond ? nz(ph2[1]) : nz(ph3[1])
ph2 := swh_cond ? nz(ph1[1]) : nz(ph2[1])
ph1 := swh_cond ? hprice     : nz(ph1[1])

pl3 := swl_cond ? nz(pl2[1]) : nz(pl3[1])
pl2 := swl_cond ? nz(pl1[1]) : nz(pl2[1])
pl1 := swl_cond ? lprice     : nz(pl1[1])

pphprice := swh_cond and ph2 > ph1 and ph2 > ph3 ? ph2 : nz(pphprice[1])
pplprice := swl_cond and pl2 < pl1 and pl2 < pl3 ? pl2 : nz(pplprice[1])


if (le)
    strategy.entry("PP_RevLE", strategy.long, comment="PP_RevLE", stop=pphprice + syminfo.mintick)

if (se)
    strategy.entry("PP_RevSE", strategy.short, comment="PP_RevSE", stop=pplprice - syminfo.mintick)

// Plotting
plot(lprice, color = color.red,   transp = 55)
plot(hprice, color = color.green, transp = 55)

plot(pplprice, color = color.red,   transp = 0, linewidth = 2)
plot(pphprice, color = color.green, transp = 0, linewidth = 2)