Strategi perdagangan emas berdasarkan momentum dan sisihan piawai
Gambaran keseluruhan
Strategi ini menilai keadaan jual beli yang berlebihan di pasaran dengan mengira sejauh mana harga emas menyimpang dari purata bergerak indeks 21 hari, digabungkan dengan perbezaan piawai, dan mengambil strategi mengikuti trend apabila tahap penyimpangan mencapai perbezaan piawai tertentu, sambil menetapkan mekanisme hentian kerugian untuk mengawal risiko.
Prinsip Strategi
- Hitung purata bergerak indeks 21 hari sebagai paksi tengah
- Mengira perbezaan antara harga emas dengan purata bergerak
- Pengiktirafan untuk penyingkiran, penukaran ke Z-Score
- Apabila Z-Score di atas 0.5, buat lebih; apabila Z-Score di bawah -0.5, buat kosong
- Z-Score turun ke paras paras paras 0.5/-0.5
- Z-Score melebihi 3⁄3, hentikan
Analisis kelebihan
Ini adalah strategi trend-tracking yang berdasarkan kepada pergerakan harga dan perbezaan piawaian untuk menilai pasaran yang terlalu banyak membeli dan terlalu banyak menjual, dengan kelebihan sebagai berikut:
- Menggunakan purata bergerak sebagai sokongan / rintangan dinamik untuk menangkap trend
- Skor standar dan Skor Z sangat baik untuk menilai kelebihan beli dan kelebihan jual, mengurangkan isyarat palsu
- Menggunakan purata bergerak indeks, lebih sensitif terhadap harga terkini
- Z-Score menstandardkan bias harga untuk membuat peraturan penilaian lebih seragam
- Menetapkan mekanisme hentikan kerugian, boleh hentikan kerugian tepat pada masanya, mengawal risiko
Analisis risiko
Strategi ini mempunyai beberapa risiko:
- Rata-rata bergerak sebagai penanda aras, memberi isyarat yang salah apabila harga melangkaui atau menembusi
- Kelemahan standard dan Z-Score perlu ditetapkan dengan betul, terlalu besar atau terlalu kecil akan mempengaruhi prestasi strategi
- Tetapan stop loss yang tidak betul, mungkin terlalu radikal dan menyebabkan kerugian yang tidak perlu
- Kejadian mendadak menyebabkan harga turun naik dengan ketara, yang boleh mencetuskan stop loss dan kehilangan peluang trend.
Penyelesaian:
- Tetapan parameter purata bergerak yang munasabah, mengenal pasti trend utama
- Mencari nilai terhad yang optimum dengan mengkaji semula parameter standard deviasi optimum
- Tetapkan Trailing Stop Rationaliti Dasar Pemeriksaan Kerosakan
- Memeriksa semula keadaan pasaran dalam masa yang tepat selepas kejadian, menyesuaikan parameter strategi
Arah pengoptimuman
Strategi ini boleh dioptimumkan dalam beberapa aspek:
- Menggunakan indikator kadar turun naik seperti ATR sebagai pengganti standard deviasi mudah untuk menentukan selera risiko yang lebih baik
- Cuba pelbagai jenis purata bergerak untuk mencari penunjuk yang lebih sesuai
- Optimumkan parameter purata bergerak, Identify terbaik purata pusingan
- Mengoptimumkan had Z-Score untuk mencari parameter prestasi strategi terbaik
- Menambah kaedah penutupan berdasarkan kadar turun naik untuk membuat penutupan lebih bijak dan munasabah
ringkaskan
Strategi ini secara keseluruhannya adalah strategi pengesanan trend yang munasabah. Ia menggunakan purata bergerak untuk menentukan arah trend utama, dan dengan pemprosesan piawaian penyimpangan harga, anda dapat mengetahui dengan jelas keadaan jual beli yang berlebihan di pasaran, sehingga menghasilkan isyarat perdagangan. Menetapkan cara berhenti yang munasabah juga membolehkan strategi mengawal risiko sambil menjamin keuntungan. Dengan mengoptimumkan parameter lebih lanjut dan menambahkan lebih banyak penilaian syarat, anda dapat menjadikan strategi lebih stabil dan boleh dipercayai, dengan nilai aplikasi yang kuat.
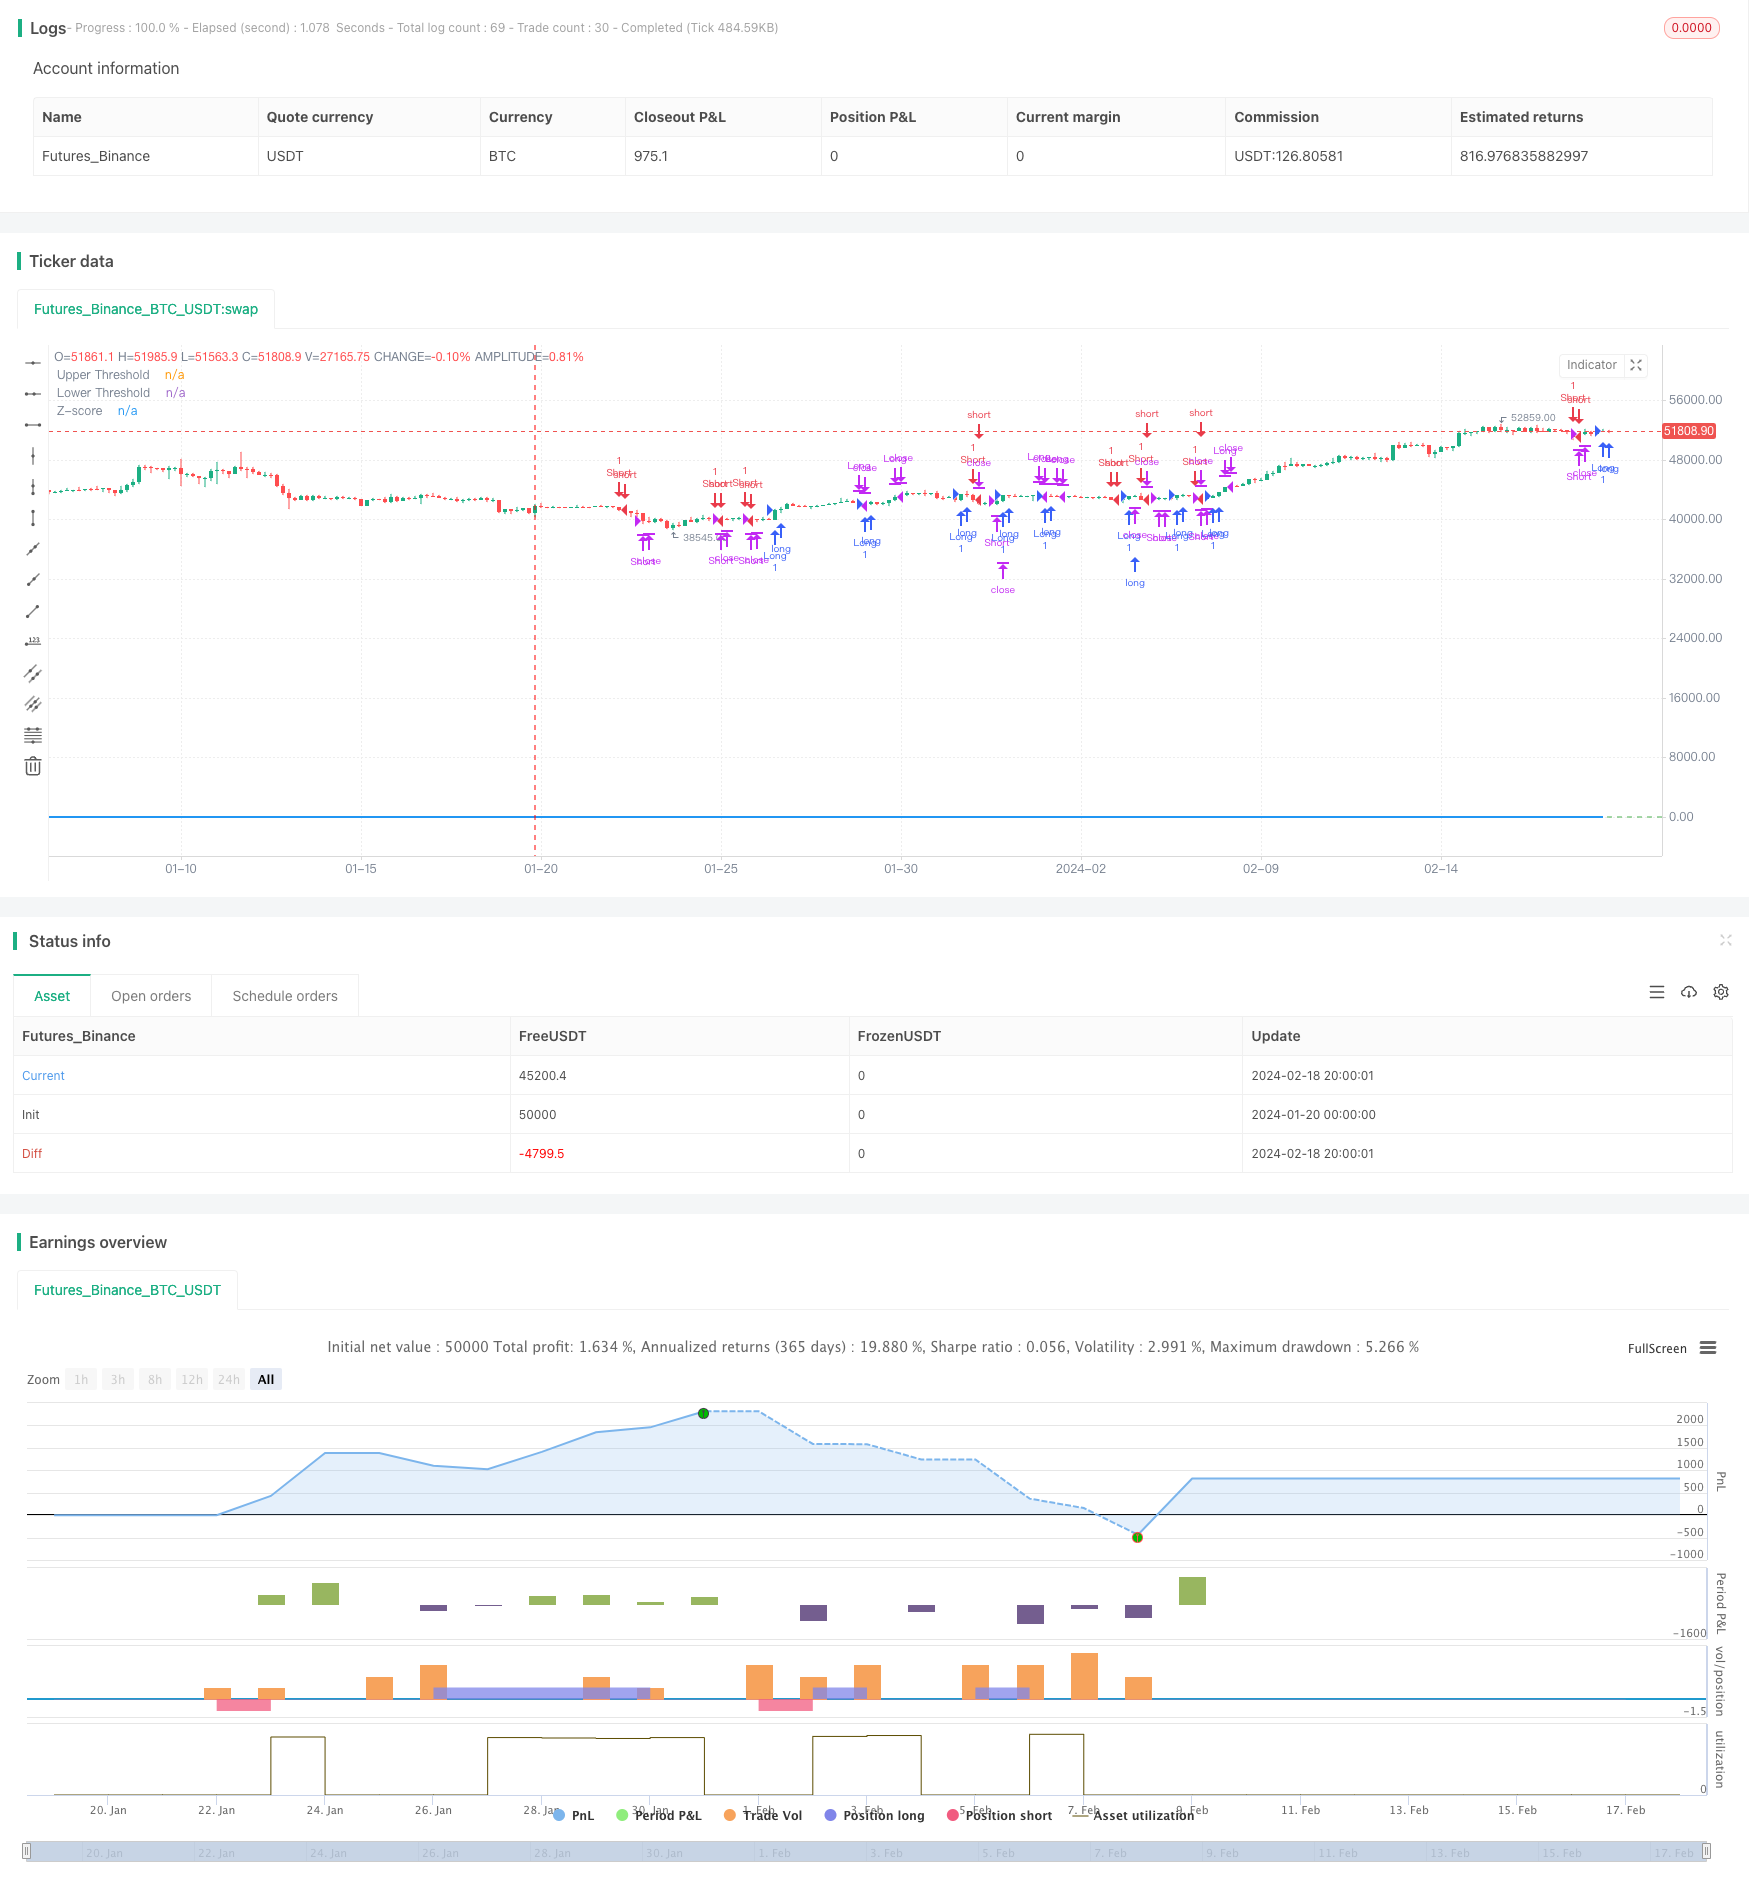
/*backtest
start: 2024-01-20 00:00:00
end: 2024-02-19 00:00:00
period: 4h
basePeriod: 15m
exchanges: [{"eid":"Futures_Binance","currency":"BTC_USDT"}]
*/

//@version=5
strategy("GC Momentum Strategy with Stoploss and Limits", overlay=true)

// Input for the length of the EMA
ema_length = input.int(21, title="EMA Length", minval=1)

// Exponential function parameters
steepness = 2

// Calculate the EMA
ema = ta.ema(close, ema_length)

// Calculate the deviation of the close price from the EMA
deviation = close - ema

// Calculate the standard deviation of the deviation
std_dev = ta.stdev(deviation, ema_length)

// Calculate the Z-score
z_score = deviation / std_dev

// Long entry condition if Z-score crosses +0.5 and is below 3 standard deviations
long_condition = ta.crossover(z_score, 0.5)

// Short entry condition if Z-score crosses -0.5 and is above -3 standard deviations
short_condition = ta.crossunder(z_score, -0.5)

// Exit long position if Z-score converges below 0.5 from top
exit_long_condition = ta.crossunder(z_score, 0.5)

// Exit short position if Z-score converges above -0.5 from below
exit_short_condition = ta.crossover(z_score, -0.5)

// Stop loss condition if Z-score crosses above 3 or below -3
stop_loss_long = ta.crossover(z_score, 3)
stop_loss_short = ta.crossunder(z_score, -3)

// Enter and exit positions based on conditions
if (long_condition)
    strategy.entry("Long", strategy.long)
if (short_condition)
    strategy.entry("Short", strategy.short)
if (exit_long_condition)
    strategy.close("Long")
if (exit_short_condition)
    strategy.close("Short")
if (stop_loss_long)
    strategy.close("Long")
if (stop_loss_short)
    strategy.close("Short")

// Plot the Z-score on the chart
plot(z_score, title="Z-score", color=color.blue, linewidth=2)

// Optional: Plot zero lines for reference
hline(0.5, "Upper Threshold", color=color.red)
hline(-0.5, "Lower Threshold", color=color.green)