Ichimoku Kinko Hyo + Shift Trend Superposition Strategi Kuantitatif
Gambaran keseluruhan
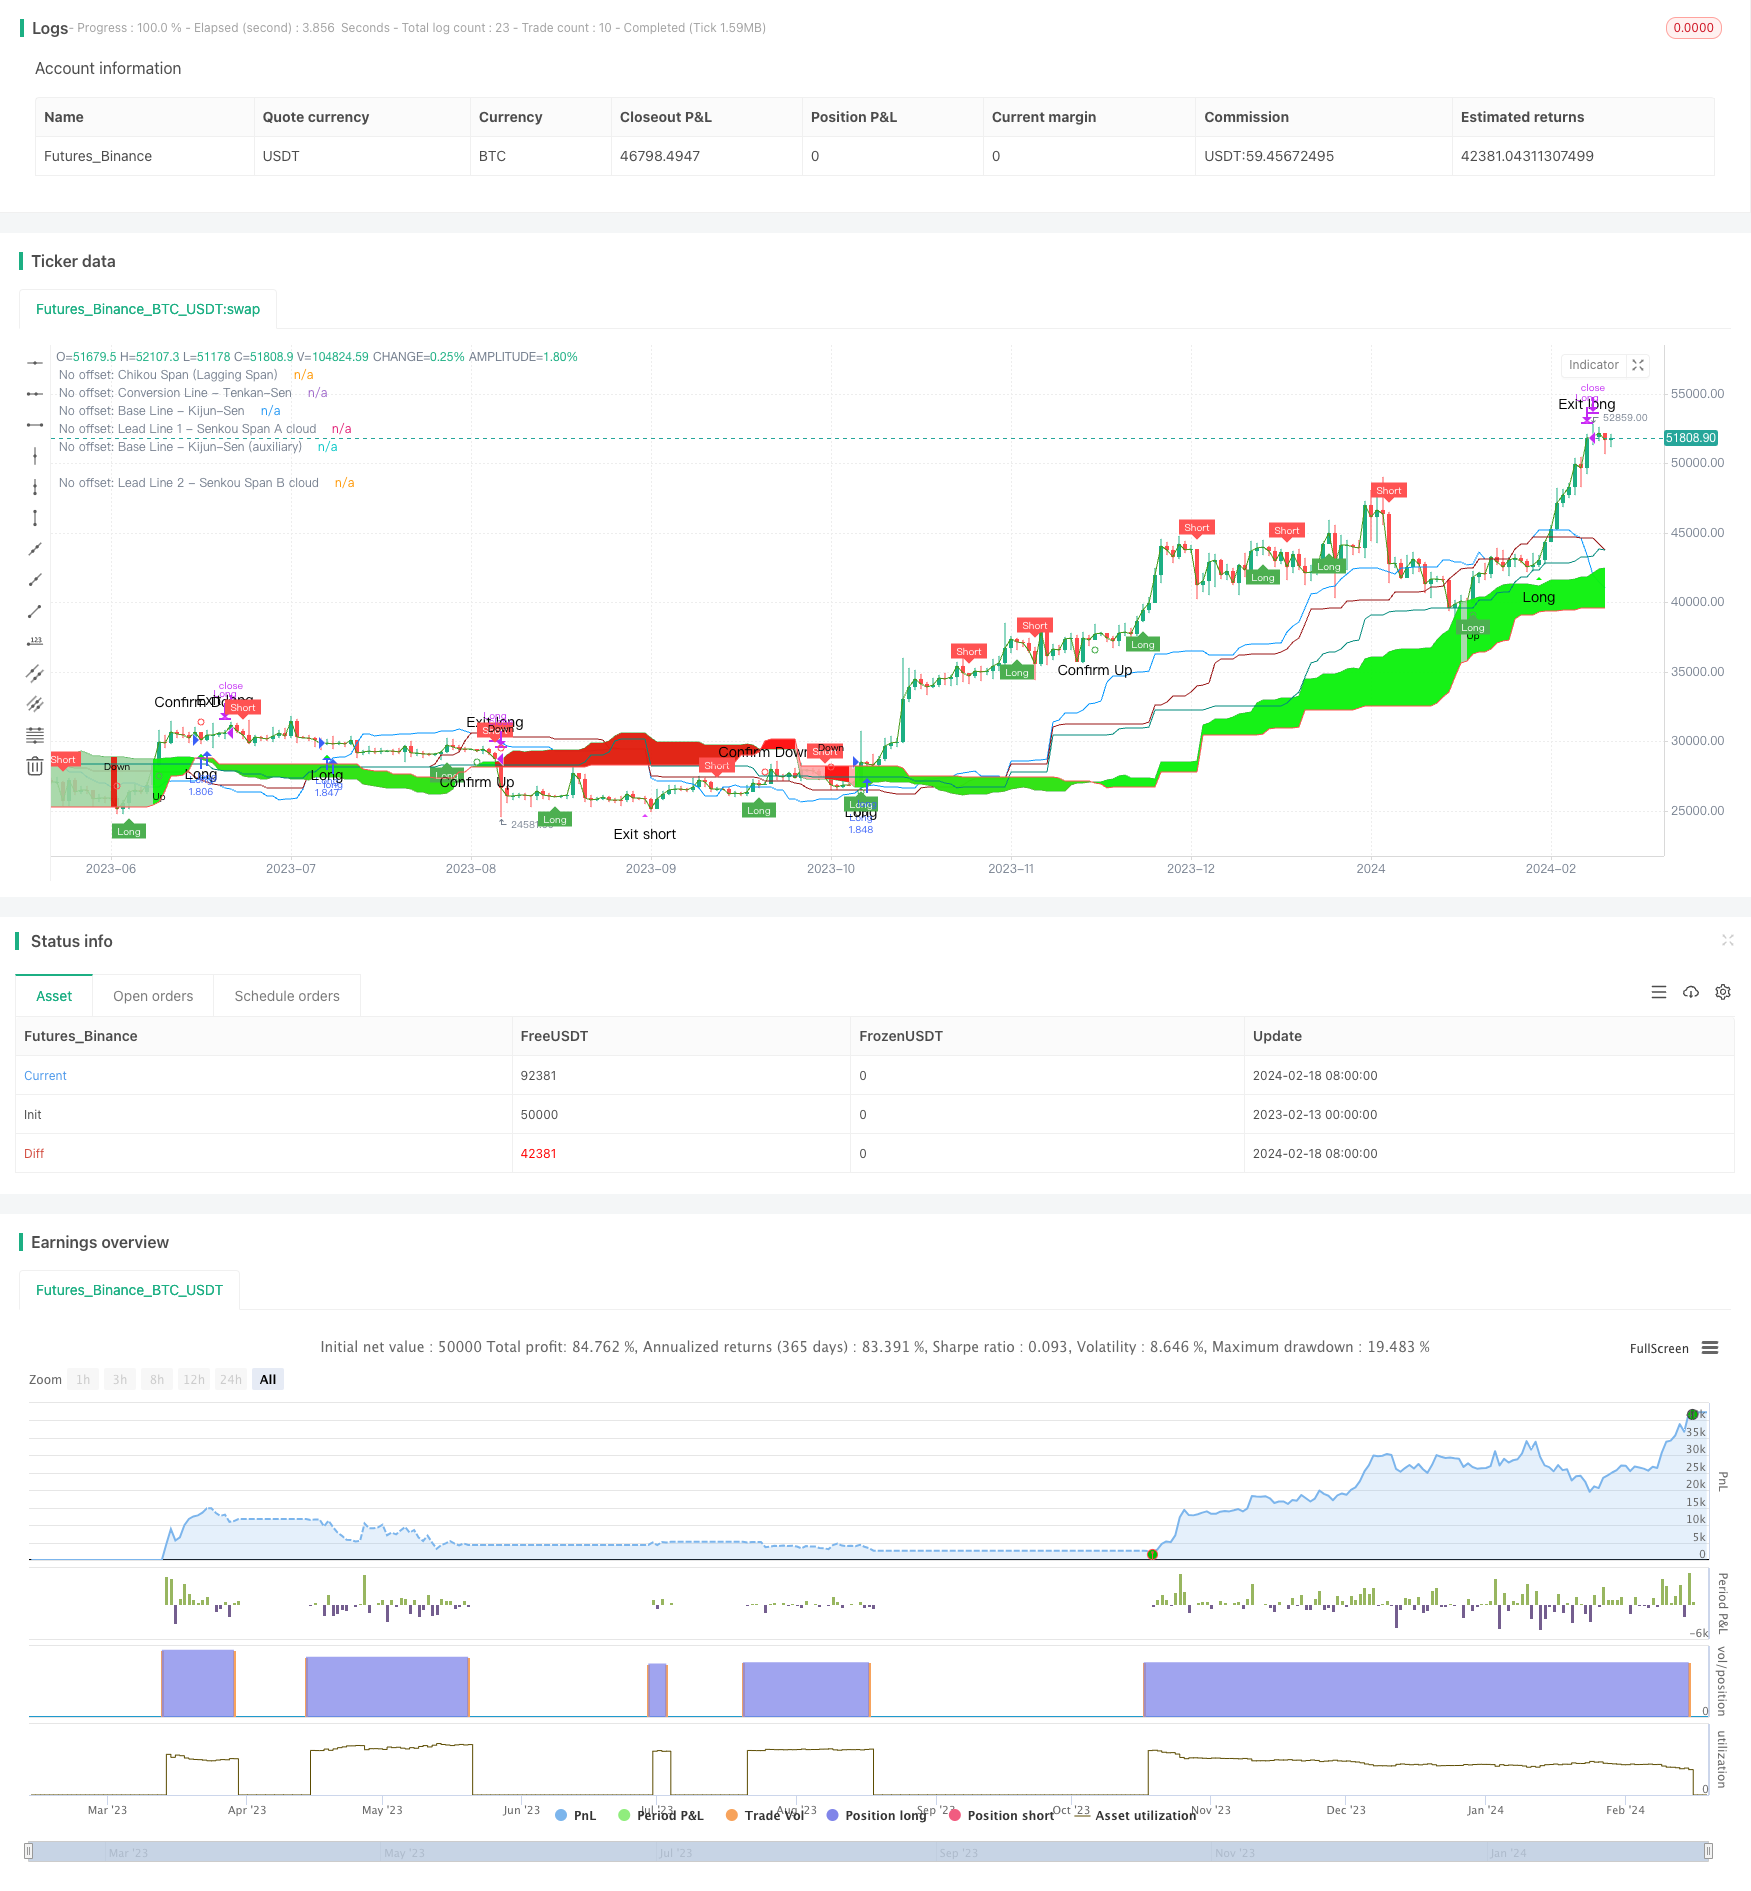
Strategi ini adalah gabungan indikator keseimbangan pertama dan indikator overlap pergerakan untuk mencari trend yang berpotensi dalam harga saham, untuk menentukan masa untuk membeli dan menjual. Strategi ini dengan mengira garis keseimbangan pertama, digabungkan dengan indikator overlap pergerakan untuk menentukan arah trend dan menghantar isyarat perdagangan, sambil menggunakan indikator RSI untuk menyaring untuk mengawal risiko perdagangan.
Prinsip Strategi
Strategi ini terdiri daripada tiga bahagian utama:
Indikator keseimbangan pertama: Indikator keseimbangan pertama menggunakan dua garis yang terdiri daripada titik peralihan ((Tenkan-Sen) dan titik rujukan ((Kijun-sen), yang membentuk bentuk yang seimbang pada pandangan pertama. Garis titik peralihan mewakili trend harga jangka pendek, dan garis titik rujukan mewakili trend harga pertengahan. Garis titik peralihan dan persilangan garis titik rujukan membentuk isyarat membeli dan menjual.
Penunjuk overlap pergerakan: Penunjuk overlap pergerakan menilai arah trend dengan mengira band antara nilai relatif yang terpisah dan nilai relatif yang bergeser. Isyarat perdagangan dihasilkan apabila harga memasuki band antara kawasan luar.
Penunjuk RSI: Penunjuk RSI digunakan untuk menentukan sama ada harga telah melampaui batas atau oversold, menetapkan garisan overbought dan oversold, dan bersama-sama dengan isyarat perdagangan yang digabungkan dengan isyarat overbought bergerak untuk menentukan isyarat beli dan jual.
Khususnya, strategi ini akan memantau apakah garis titik peralihan dan garis titik rujukan berlaku untuk bergolak emas (permukaan garis titik rujukan pada garis titik peralihan) dan bergolak mati (permukaan garis titik rujukan di bawah garis titik peralihan) untuk menentukan masa membeli dan menjual. Di samping itu, digabungkan dengan pergerakan tumpang tindih untuk menentukan arah trend keseluruhan. Apabila kedua-dua indikator memberi isyarat pada masa yang sama, isyarat perdagangan dikeluarkan jika indikator RSI menunjukkan tidak ada overbought atau oversold.
Kelebihan Strategik
Strategi ini digabungkan dengan penggunaan pelbagai petunjuk untuk menentukan arah trend dan masa perdagangan, yang dapat meningkatkan ketepatan penilaian, memanfaatkan kelebihan saling melengkapi antara petunjuk, dan mengelakkan kemungkinan kesalahan penilaian satu petunjuk. Kelebihan khusus adalah sebagai berikut:
Menggunakan garis titik peralihan dan garis titik asas untuk membentuk penunjuk keseimbangan pertama, ia boleh mencerminkan trend jangka pendek dan trend jangka menengah pada masa yang sama, dengan ketepatan yang lebih tinggi daripada penunjuk MA tunggal.
Penunjuk overlay pergerakan menentukan arah trend keseluruhan dengan tepat dan boleh dipercayai, dan membentuk saling melengkapi dengan penunjuk keseimbangan pertama.
Penunjuk RSI menetapkan syarat penapisan yang berkesan untuk menapis penembusan palsu dan mengelakkan risiko perdagangan.
Strategi ini mudah difahami dan diimplementasikan untuk transaksi kuantitatif.
Risiko Strategik
Walaupun strategi ini menggunakan pelbagai indikator untuk membuat penilaian yang berpasangan, ia dapat mengurangkan kemungkinan kesalahan penilaian, tetapi terdapat risiko utama seperti berikut:
Pengaturan parameter berisiko. Pengaturan parameter penunjuk seperti garis titik peralihan, garis titik asas yang tidak betul akan menyebabkan kesilapan isyarat perdagangan. Parameter perlu dioptimumkan untuk menyesuaikan diri dengan pelbagai jenis.
Risiko pembalikan trend. Dalam keadaan penumpuan, isyarat palsu mungkin dihasilkan. Isyarat pembalikan trend perlu dikombinasikan dengan lebih banyak petunjuk.
Risiko bahawa syarat penapisan RSI terlalu ketat. Mungkin membuang lebih banyak peluang perdagangan. Parameter RSI boleh dilonggarkan dengan sewajarnya.
Penyelesaian:
Menggunakan lebih banyak data sejarah untuk mengoptimumkan parameter untuk pelbagai jenis dan memastikan parameter yang ditetapkan adalah munasabah.
Menambahkan mekanisme hentikan kerugian dalam strategi. Keluar dari kedudukan apabila harga melanggar garis hentikan kerugian ke arah yang bertentangan.
Mengoptimumkan parameter RSI, melonggarkan syarat penapisan dengan sewajarnya, untuk mendapatkan lebih banyak peluang perdagangan dengan syarat mengawal risiko.
Arah pengoptimuman strategi
Strategi ini juga boleh terus dioptimumkan:
Menambah algoritma pembelajaran mesin untuk menyesuaikan parameter strategi secara dinamik dengan perubahan pasaran, meningkatkan kebolehlakuan strategi.
Membungkus komponen strategi menjadi modul, untuk pengurusan modul, untuk memudahkan penggantian komponen dengan cepat atau menguji komponen yang dioptimumkan secara berasingan, meningkatkan kecekapan pembangunan.
Menambah modul integrasi data, mendapatkan data pasaran dari lebih banyak sumber data, membentuk set latihan berkualiti tinggi, meningkatkan kesan pembelajaran mesin.
Membangunkan alat pengesanan semula untuk pengesanan semula strategi secara menyeluruh, merekodkan pelbagai indikator penilaian, penyesuaian parameter optimasi tambahan dan pilihan model.
Menggunakan platform pengkomputeran awan untuk menyebarkan sistem strategi, menggunakan sumber pengkomputeran yang fleksibel untuk mengkaji semula secara selari dengan cepat, mempercepatkan iterasi parameter, dan mengurangkan kos pembangunan strategi.
ringkaskan
Strategi ini menggunakan indikator keseimbangan pertama dan indikator penumpukan pergerakan dua indikator untuk bekerjasama, saling melengkapi menentukan trend harga dan masa perdagangan. Pada masa yang sama menggunakan indikator RSI untuk menyaring dan mengawal risiko perdagangan. Bentuk strategi gabungan pelbagai indikator ini dapat meningkatkan ketepatan penghakiman dan mendapatkan kesan strategi yang lebih baik.
/*backtest
start: 2023-02-13 00:00:00
end: 2024-02-19 00:00:00
period: 1d
basePeriod: 1h
exchanges: [{"eid":"Futures_Binance","currency":"BTC_USDT"}]
*/

// This source code is subject to the terms of the Mozilla Public License 2.0 at https://mozilla.org/MPL/2.0/
// © KryptoNight

//@version=4
// comment/uncomment Study/Strategy to easily switch modes
// study("Ichimoku Kinko Hyo Cloud - no offset - no repaint - RSI filter - alerts", shorttitle="IchiCloud + RSI - alerts", overlay=true)
// ============================================================================== Strategy mode - uncomment to activate
strategy("Ichimoku Kinko Hyo Cloud - no offset - no repaint - RSI filter - strategy", shorttitle="IchiCloud + RSI - Strategy Tester Mode", overlay=true, pyramiding = 0,
  currency = currency.EUR, initial_capital = 2000, default_qty_type = strategy.percent_of_equity, default_qty_value = 100,
  calc_on_every_tick = true, calc_on_order_fills = true, commission_type = strategy.commission.percent, commission_value = 0.15)
// ==============================================================================

// ------------------------------------------------------------------------------

ichiCloud_offset   = input(false, title="Standard Ichimoku Cloud")                  // with the visual offset
ichiCloud_noOffset = input(true,  title="Ichimoku Cloud - no offset - no repaint")  // without the visual offset

conversion_prd = input(9, minval=1, title="Conversion Line Period - Tenkan-Sen")
baseline_prd   = input(27, minval=1, title="Base Line Period - Kijun-Sen")
baselineA_prd  = input(52, minval=1, title="Base Line Period - Kijun-Sen (auxiliary)")
leadingSpan_2prd = input(52, minval=1, title="Lagging Span 2 Periods - Senkou Span B")
displacement = input(26, minval=0, title="Displacement: (-) Chikou Span; (+) Senkou Span A")
extra_bars = input(1, minval=0, title="Displacement: additional bars")
laggingSpan_src = input(close, title="Lagging Span price source - Chikou-Span")

donchian(len) => avg(lowest(len), highest(len))
displ = displacement-extra_bars
// ------------------------------------------------------------------------------
// OFFSET:
conversion = donchian(conversion_prd)   // Conversion Line - Tenkan-Sen (9 Period)
baseline  = donchian(baseline_prd)      // Base Line - Kijun-Sen (26 Period)
baselineA = donchian(baselineA_prd)     // Base Line Period - Kijun-Sen (auxiliary)
leadingSpanA = avg(conversion, baseline)
leadingSpanB = donchian(leadingSpan_2prd)
laggingSpan = laggingSpan_src

// Color - bullish, bearish
col_cloud = leadingSpanA>=leadingSpanB ? color.green : color.red

// Cloud Lines
spanA = plot(ichiCloud_offset? leadingSpanA : na, offset=displ, title="Offset: Lead Line 1 - Senkou Span A cloud", color=color.green)
spanB = plot(ichiCloud_offset? leadingSpanB : na, offset=displ, title="Offset: Lead Line 2 - Senkou Span B cloud", color=color.red)
fill(spanA, spanB, color=col_cloud, transp=80, title="Offset: Ichimoku Cloud - Leading Span 1 & 2 based coloring")

// Other Lines
conversion_p = plot(ichiCloud_offset? conversion : na, title="Offset: Conversion Line - Tenkan-Sen", color=#0496ff)
standard_p = plot(ichiCloud_offset? baseline : na, title="Offset: Base Line - Kijun-Sen", color=#991515)
standardA_p = plot(ichiCloud_offset? baselineA : na, title="Offset: Base Line - Kijun-Sen (auxiliary)", color=color.teal)
lagging_Span_p = plot(ichiCloud_offset? laggingSpan : na, offset=-displ, title="Offset: Chikou Span (Lagging Span)", color=#459915)

// ------------------------------------------------------------------------------
// NO OFFSET:
conversion_noOffset = conversion[displ] // Conversion Line - Tenkan-Sen (9 Period)
baseline_noOffset  = baseline[displ]    // Base Line - Kijun-Sen (26 Period)
baselineA_noOffset = baselineA[displ]   // Base Line Period - Kijun-Sen (auxiliary)
leadingSpanA_noOffset = leadingSpanA[displ*2]
leadingSpanB_noOffset = leadingSpanB[displ*2]
laggingSpan_noOffset = laggingSpan[0]

// Color - bullish, bearish
col_cloud_noOffset = leadingSpanA_noOffset>=leadingSpanB_noOffset ? color.green : color.red

// Cloud Lines
spanA_noOffset = plot(ichiCloud_noOffset? leadingSpanA_noOffset : na, title="No offset: Lead Line 1 - Senkou Span A cloud", color=color.green, transp=0)
spanB_noOffset = plot(ichiCloud_noOffset? leadingSpanB_noOffset : na, title="No offset: Lead Line 2 - Senkou Span B cloud", color=color.red, transp=0)
fill(spanA_noOffset, spanB_noOffset, color=col_cloud_noOffset, transp=80, title="No offset: Ichimoku Cloud - Leading Span 1 & 2 based coloring")

// Other Lines
conversion_p_noOffset = plot(ichiCloud_noOffset? conversion_noOffset : na, title="No offset: Conversion Line - Tenkan-Sen", color=#0496ff, transp=0)
baseline_p_noOffset = plot(ichiCloud_noOffset? baseline_noOffset : na, title="No offset: Base Line - Kijun-Sen", color=#991515, transp=0)
baselineA_p_noOffset = plot(ichiCloud_noOffset? baselineA_noOffset : na, title="No offset: Base Line - Kijun-Sen (auxiliary)", color=color.teal, transp=0)
laggingSpan_p_noOffset = plot(ichiCloud_noOffset? laggingSpan_noOffset : na, title="No offset: Chikou Span (Lagging Span)", color=#459915, transp=0)

// ==============================================================================
// Conditions & Alerts (based on the lines without offset)

maxC = max(leadingSpanA_noOffset,leadingSpanB_noOffset)
minC = min(leadingSpanA_noOffset,leadingSpanB_noOffset)

// Trend start signals: crosses between Chikou Span (Lagging Span) and the Cloud (Senkou Span A, Senkou Span B)
uptrend_start   = crossover(laggingSpan_noOffset,maxC)
downtrend_start = crossunder(laggingSpan_noOffset,minC)

// Trends
uptrend   = laggingSpan_noOffset>maxC // Above Cloud
downtrend = laggingSpan_noOffset<minC // Below Cloud

// No trend: choppy trading - the price is in transition
notrend = maxC>=laggingSpan_noOffset and laggingSpan_noOffset>=minC

// Confirmations
uptrend_confirm   = crossover(leadingSpanA_noOffset,leadingSpanB_noOffset)
downtrend_confirm = crossunder(leadingSpanA_noOffset,leadingSpanB_noOffset)

// Signals - crosses between Conversion Line (Tenkan-Sen) and Base Line (Kijun-Sen)
bullish_signal = crossover(conversion_noOffset,baseline_noOffset)
bearish_signal = crossunder(conversion_noOffset,baseline_noOffset)

// Various alerts
alertcondition(uptrend_start,   title="Uptrend Started",   message="Uptrend Started")
alertcondition(downtrend_start, title="Downtrend Started", message="Downtrend Started")

alertcondition(uptrend_confirm,   title="Uptrend Confirmed",   message="Uptrend Confirmed")
alertcondition(downtrend_confirm, title="Downtrend Confirmed", message="Downtrend Confirmed")

alertcondition(bullish_signal, title="Buy Signal",  message="Buy Signal")
alertcondition(bearish_signal, title="Sell Signal", message="Sell Signal")

rsi_OBlevel = input(50, title="RSI Filter: Overbought level (0 = off)")
rsi_OSlevel = input(100,title="RSI Filter: Oversold level (100 = off)")
rsi_len = input(14,title="RSI Length")
rsi_src = input(close,title="RSI Price source")
rsi = rsi(rsi_src,rsi_len)

// Strategy -------------------------------
long_signal  = bullish_signal and uptrend   and rsi<=rsi_OSlevel // breakout filtered by the rsi
exit_long    = bearish_signal and uptrend
short_signal = bearish_signal and downtrend and rsi>=rsi_OBlevel // breakout filtered by the rsi
exit_short   = bullish_signal and downtrend

// Strategy alerts
alertcondition(long_signal, title="Long Signal - Uptrend",      message="Long Signal - Uptrend")
alertcondition(exit_long,   title="Long Exit Signal - Uptrend", message="Long Exit Signal - Uptrend")

alertcondition(short_signal, title="Long Signal - Downtrend",       message="Long Signal - Downtrend")
alertcondition(exit_short,   title="Short Exit Signal - Downtrend", message="Short Exit Signal - Downtrend")

// Plot areas for trend and transition
color_trend = uptrend? #00FF00 : downtrend? #FF0000 : notrend? color.new(#FFFFFF, 50) : na
fill(spanA_noOffset, spanB_noOffset, color=color_trend, transp=90, title="No offset: Ichimoku Cloud - Lagging Span & Cloud based coloring")

plotshape(ichiCloud_noOffset?uptrend_start:na, title="No offset: Uptrend Started", color=color.green, style=shape.circle, location=location.belowbar, size=size.tiny, text="Up")
plotshape(ichiCloud_noOffset?downtrend_start:na, title="No offset: Downtrend Started", color=color.red, style=shape.circle,location=location.abovebar, size=size.tiny, text="Down")

plotshape(ichiCloud_noOffset?uptrend_confirm:na, title="No offset: Uptrend Confirmed", color=color.green, style=shape.circle, location=location.belowbar, size=size.small, text="Confirm Up")
plotshape(ichiCloud_noOffset?downtrend_confirm:na, title="No offset: Downtrend Confirmed", color=color.red, style=shape.circle, location=location.abovebar, size=size.small, text="Confirm Down")

plotshape(ichiCloud_noOffset?long_signal:na, title="No offset: Long Signal", color=#00FF00, style=shape.triangleup, location=location.belowbar, size=size.small, text="Long")
plotshape(ichiCloud_noOffset?exit_long:na, title="No offset: Exit Long Signal", color=color.fuchsia, style=shape.triangledown, location=location.abovebar, size=size.small, text="Exit long")

plotshape(ichiCloud_noOffset?short_signal:na, title="No offset: Short Signal", color=#FF0000, style=shape.triangledown, location=location.abovebar, size=size.small, text="Short")
plotshape(ichiCloud_noOffset?exit_short:na, title="No offset: Exit Short Signal", color=color.fuchsia, style=shape.triangleup, location=location.belowbar, size=size.small, text="Exit short")

// ============================================================================== Strategy Component - uncomment to activate
if (long_signal)
    strategy.entry("Long",strategy.long)
if (exit_long)
    strategy.close("Long")
// if (short_signal)
//    strategy.entry("Short",strategy.short)
// if (exit_short)
//    strategy.close("Short")
// ==============================================================================


//@version=4
// This source code is subject to the terms of the Mozilla Public License 2.0 at https://mozilla.org/MPL/2.0/
// © colinmck


RSI_Period = input(10, title='RSI Length')
SF = input(5, title='RSI Smoothing')
QQE = input(2.438, title='Fast QQE Factor')
ThreshHold = input(10, title="Thresh-hold")

src = close
Wilders_Period = RSI_Period * 3 - 1

Rsi = rsi(src, RSI_Period)
RsiMa = ema(Rsi, SF)
AtrRsi = abs(RsiMa[1] - RsiMa)
MaAtrRsi = ema(AtrRsi, Wilders_Period)
dar = ema(MaAtrRsi, Wilders_Period) * QQE

longband = 0.0
shortband = 0.0
trend = 0

DeltaFastAtrRsi = dar
RSIndex = RsiMa
newshortband = RSIndex + DeltaFastAtrRsi
newlongband = RSIndex - DeltaFastAtrRsi
longband := RSIndex[1] > longband[1] and RSIndex > longband[1] ? max(longband[1], newlongband) : newlongband
shortband := RSIndex[1] < shortband[1] and RSIndex < shortband[1] ? min(shortband[1], newshortband) : newshortband
cross_1 = cross(longband[1], RSIndex)
trend := cross(RSIndex, shortband[1]) ? 1 : cross_1 ? -1 : nz(trend[1], 1)
FastAtrRsiTL = trend == 1 ? longband : shortband

// Find all the QQE Crosses

QQExlong = 0
QQExlong := nz(QQExlong[1])
QQExshort = 0
QQExshort := nz(QQExshort[1])
QQExlong := FastAtrRsiTL < RSIndex ? QQExlong + 1 : 0
QQExshort := FastAtrRsiTL > RSIndex ? QQExshort + 1 : 0

//Conditions

qqeLong = QQExlong == 1 ? FastAtrRsiTL[1] - 50 : na
qqeShort = QQExshort == 1 ? FastAtrRsiTL[1] - 50 : na

// Plotting

plotshape(qqeLong, title="QQE long", text="Long", textcolor=color.white, style=shape.labelup, location=location.belowbar, color=color.green, transp=0, size=size.tiny)
plotshape(qqeShort, title="QQE short", text="Short", textcolor=color.white, style=shape.labeldown, location=location.abovebar, color=color.red, transp=0, size=size.tiny)

// Alerts

alertcondition(qqeLong, title="Long", message="Long")
alertcondition(qqeShort, title="Short", message="Short")