Benderakan Strategi Pemecahan
Gambaran keseluruhan
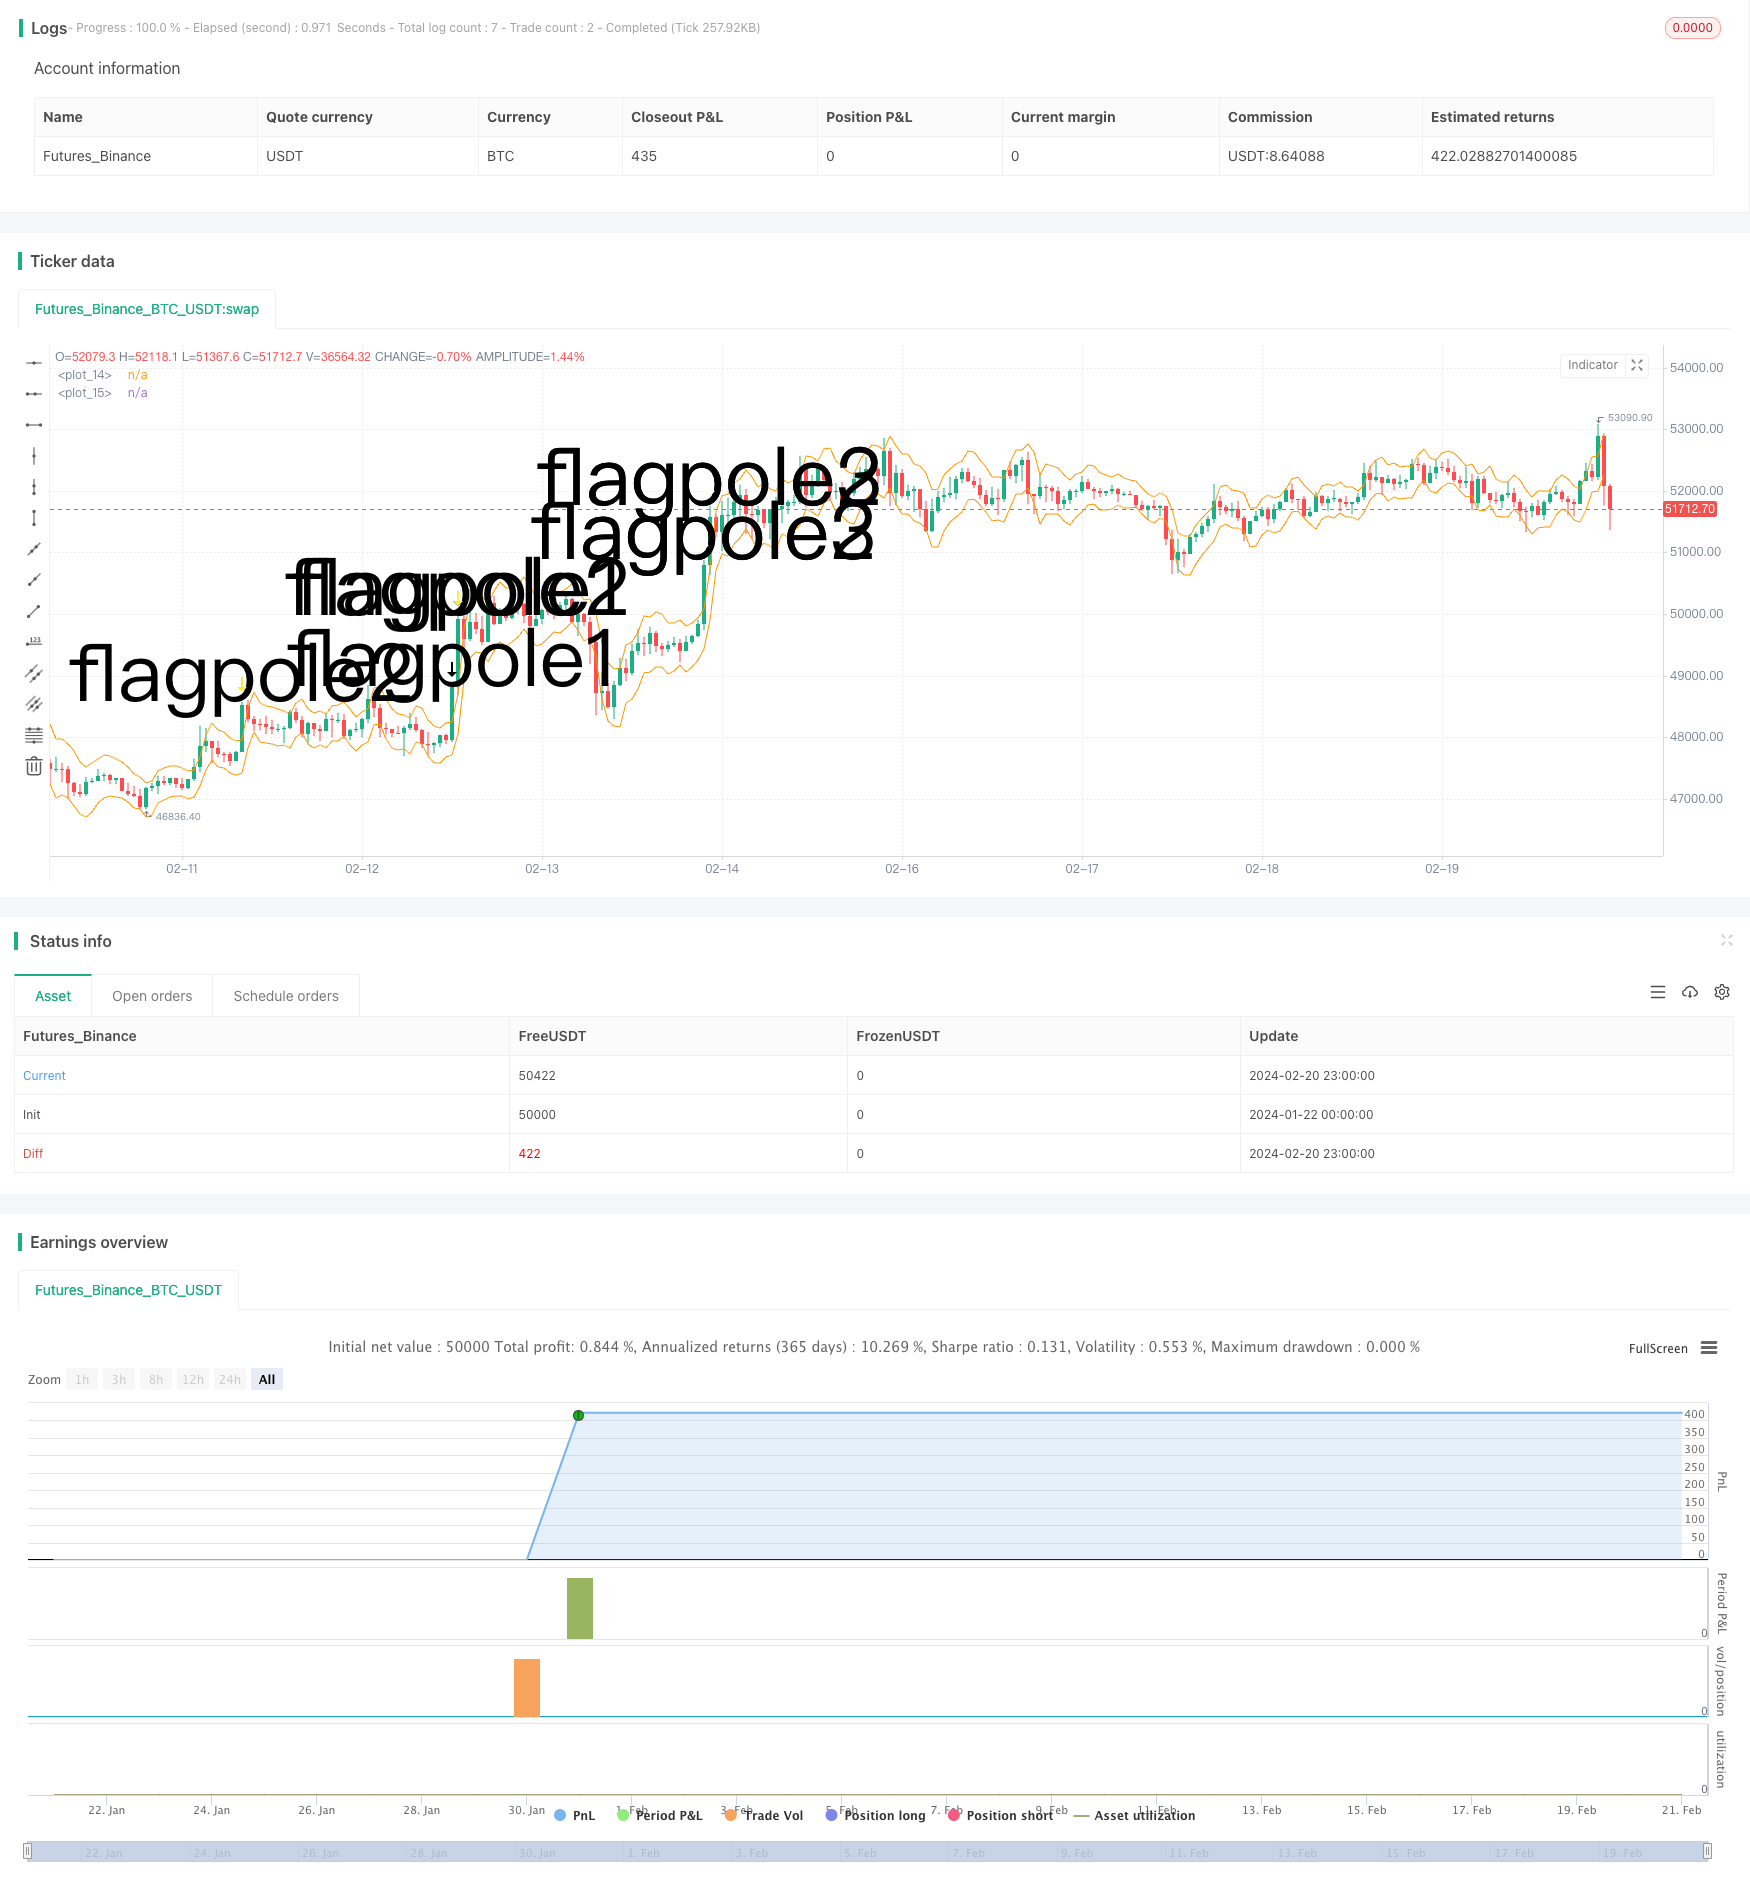
Strategi penembusan bendera adalah strategi analisis teknikal yang bertujuan untuk menangkap permulaan trend dengan mengenal pasti grafik bendera dan masuk ke dalam titik penembusan. Strategi ini menggunakan pengukur penilaian tambahan Julat Rata-rata Pergerakan Nyata (ATR) untuk menilai julat bendera selepas tiang bendera yang jelas, dan dengan itu menyaring peluang masuk.
Prinsip Strategi
Strategi ini terdiri daripada beberapa langkah utama:
- Menentukan tiang bendera: keperluan untuk memenuhi inovasi harga yang tinggi dan penembusan saluran ATR.
- Menentukan ketinggian tiang bendera: mengukur jarak antara puncak tiang bendera dan SMA sebelumnya.
- Tentukan julat bendera: titik rendah bendera adalah 33% daripada ketinggian tiang bendera, sebagai julat minimum bendera.
- Tentukan jenis bendera: Tentukan sama ada 3 baris K terdahulu berada dalam ruang bendera.
- Masuk: Lebih banyak apabila bendera muncul.
- Keluar: Keluar selepas 6 garisan K.
Apabila menilai tiang dan bendera, strategi menggunakan penunjuk ATR dengan bijak untuk menilai penembusan yang jelas, dan membatasi ketinggian bendera dalam 33% ketinggian tiang, untuk mengelakkan terlalu banyak isyarat palsu. Selain itu, menilai 3 garis K berturut-turut membentuk bendera, kebolehpercayaan yang tinggi.
Analisis kelebihan
Strategi ini mempunyai beberapa kelebihan utama:
- Menggunakan struktur bendera untuk menentukan trend adalah kaedah yang lebih klasik dalam analisis teknikal, dengan kadar kejayaan yang lebih tinggi.
- Penunjuk ATR dan had julat yang ketat dapat mengelakkan banyak isyarat palsu dan meningkatkan ketepatan kemasukan.
- Tetap 6 K Line Output boleh mengunci sebahagian keuntungan, mengelakkan risiko trend berbalik.
- Peraturan-peraturan strategi jelas, mudah dilaksanakan, mudah difahami dan diikuti.
- Mereka boleh mencari peluang dalam pelbagai situasi dan lebih fleksibel.
Analisis risiko
Risiko utama dalam strategi ini ialah:
- Ia juga menunjukkan bahawa terdapat kes-kes di mana model bendera tidak dapat menilai trend sepenuhnya dan ada juga kes-kes di mana ia gagal.
- 6 K Line beraksi terlalu sembarangan dan mungkin akan berlepas lebih awal daripada jangkaan.
- Jika keadaan terlalu bergolak, ia boleh menyebabkan false flag.
- Tidak dapat mengawal kerugian secara berkesan.
Untuk menghadapi risiko di atas, kita boleh menetapkan strategi hentikan kerugian, atau mengoptimumkan mekanisme keluar, untuk mendapatkan keuntungan tepat pada masanya apabila keuntungan mencapai peratusan tertentu. Selain itu, kita juga boleh menyaring dengan indikator lain, untuk mengelakkan isyarat palsu apabila pasaran terlalu bergolak.
Arah pengoptimuman
Strategi ini boleh dioptimumkan dalam beberapa arah:
- Menggunakan gabungan penunjuk seperti MACD, KD, dan lain-lain untuk mengelakkan isyarat palsu dalam keadaan gegaran.
- Pembaharuan ATR mengikut kategori pasaran, kitaran permainan, dan lain-lain, menjadikan strategi lebih sesuai.
- Tetapkan Hentian Pergerakan atau Pertimbangkan Pengunduran Keuntungan Daripada Bermain Secara Dinamis.
- Cuba menggunakan kaedah pembelajaran mesin untuk mencari ciri-ciri yang lebih tepat untuk menentukan ketinggian bendera.
- Menilai kadar kemenangan dan kerugian sebenar, menyesuaikan saiz kedudukan secara dinamik.
ringkaskan
Secara keseluruhan, strategi penembusan bendera menggunakan trend penilaian bentuk teknologi, merupakan kaedah yang lebih klasik, strategi ini benar-benar ketat dalam reka bentuk peraturan kemasukan dan dapat menyaring banyak isyarat palsu. Tetapi mekanisme kawalan risiko dan keluar masih ada ruang untuk pengoptimuman, kita boleh mempertimbangkan dari sudut keseluruhan, supaya strategi dapat beroperasi dengan stabil di pelbagai pasaran. Jika diuji dan dioptimumkan dengan baik, strategi ini dapat menjadi komponen berharga dalam sistem perdagangan kuantitatif.
/*backtest
start: 2024-01-22 00:00:00
end: 2024-02-21 00:00:00
period: 1h
basePeriod: 15m
exchanges: [{"eid":"Futures_Binance","currency":"BTC_USDT"}]
*/

// © smith26
//This strategy enters on a bull flag and closes position 6 bars later.  Average true range is used instead of a moving average.
//The reason for ATR instead of MA is because with volatile securities, the flagpole must stand up a noticable "distance" above the trading range---which you can't determine with a MA alone.
//This is broken up into multiple parts: Defining a flagpole, defining the pole height, and defining the flag, which will be constrained to the top third (33%) of the pole height to be considered a flag.
//@version=4
strategy("Bull Flag v1.00", overlay=true)

ATR = atr(10) //Average True Range over last 10 bars.

upperATR = ohlc4[1] + ATR[1]  //Open + High + Low + Close divided by 4, + prior ATR.  Just used here for visually plotting the ATR upper channel.
lowerATR = ohlc4[1] - ATR[1] //Open + High + Low + Close divided by 4, - prior ATR.  Just used here for visually plotting the ATR lower channel.

//uncomment these two lines to see ATR channels
plot(upperATR, color=color.orange)
plot (lowerATR, color=color.orange)

//Current close higher than previous close, and current close minus current open is greater than 3 times the previous ATR.  "3x ATR" is chosen because any less was not a noticeable distance above the trading range.
flagpole1 = close>close[1] and (close-open) > (ATR[1] * 3)
plotshape(flagpole1, text="flagpole1", style=shape.arrowdown, size=size.huge) //Plots an arrow for flagpole1 for QA testing

//Two consecutive close higer than their previous close, and current close minus PREVIOUS open is greater than 3 times the previous ATR.
flagpole2 = close>close[1] and close[1]>close[2] and (close-open[1]) > (ATR[1] * 3)
plotshape(flagpole2, text="flagpole2", style=shape.arrowdown, size=size.huge, color=color.yellow) //Plots an arrow for flagpole2 for QA testing

//Three consecutive close higer than their previous close, and current close minus open from 2 bars ago is greater than 3 times the previous ATR.
flagpole3 = close>close[1] and close[1]>close[2] and close[2]>close[3] and (close-open[2]) > (ATR[1] * 3)
plotshape(flagpole3, text="flagpole3", style=shape.arrowdown, size=size.huge, color=color.white) //Plots an arrow for flagpole3 for QA testing

//A flagpole can be any of the three definitions of flagpole.
flagpole = flagpole1 or flagpole2 or flagpole3

//This will return the number of bars since "flagpole" was true.  Not being used, but could be useful.
//since_flagpole = barssince(flagpole)

after_pole_1 = flagpole[1] //This marks the bar directly after a flagpole.
//plotshape(after_pole_1, text="after_pole_1", style=shape.cross, size=size.large, color=color.white) //Plots a cross for after_pole_1 for QA testing
after_pole_2 = flagpole[2] //This marks the bar two bars after a flagpole.
after_pole_3 = flagpole[3] //This marks the bar three bars after a flagpole.

//This returns the price at the "top" of the flagpole (using close price) at the most recent occurence, 0.
pole_top = valuewhen(flagpole, close, 0)
//plot(pole_top, trackprice=true)  //plots a horizontal line at the most recent pole_top

//Measures the distance between last pole top and the previous SMA.
pole_height = pole_top - sma(close, 10)[1]
//plot(pole_height)

//This marks 33% below the pole_top, which will be the lowest point a flag can be.
flag_bottom = pole_top - (.33 * pole_height)
//plot(flag_bottom)

//The first, second, and third bars after the pole are considered part of a flag when open and close are between the pole_top and flag_bottom
flag1 = after_pole_1 and (open >= flag_bottom) and (open <= pole_top) and (close >= flag_bottom) and (close <= pole_top)
//plotshape(flag1, text="flag1", style=shape.flag, size=size.large, color=color.teal)
flag2 = after_pole_2 and (open >= flag_bottom) and (open <= pole_top) and (close >= flag_bottom) and (close <= pole_top)
//plotshape(flag2, text="flag2", style=shape.flag, size=size.large, color=color.teal)
flag3 = after_pole_3 and (open >= flag_bottom) and (open <= pole_top) and (close >= flag_bottom) and (close <= pole_top)
//plotshape(flag3, text="flag3", style=shape.flag, size=size.large, color=color.teal)

//When all three bars after a flagpole are a flag, the criteria are met and we have a "bull_flag"
//Specifically, when current bar is flag3, previous bar is flag2, and 2 bars ago is flag1, we have a bull_flag.
bull_flag = flag3 and flag2[1] and flag1[2]
plotshape(bull_flag, text="bull_flag", style=shape.flag, size=size.large, color=color.white) //Plots a flag for bull_flag for QA testing


if (bull_flag)
    strategy.entry("Long", strategy.long)

if barssince(bull_flag) == 6 //close 6 bars after entry.
    strategy.close("Long")