Triple Overlap Supertrend Strategy
Gambaran keseluruhan
Ini adalah strategi untuk membuat keputusan perdagangan dengan menggunakan tiga petanda supertrend. Ia boleh menangkap peluang arah yang lebih besar dalam keadaan trend.
Prinsip Strategi
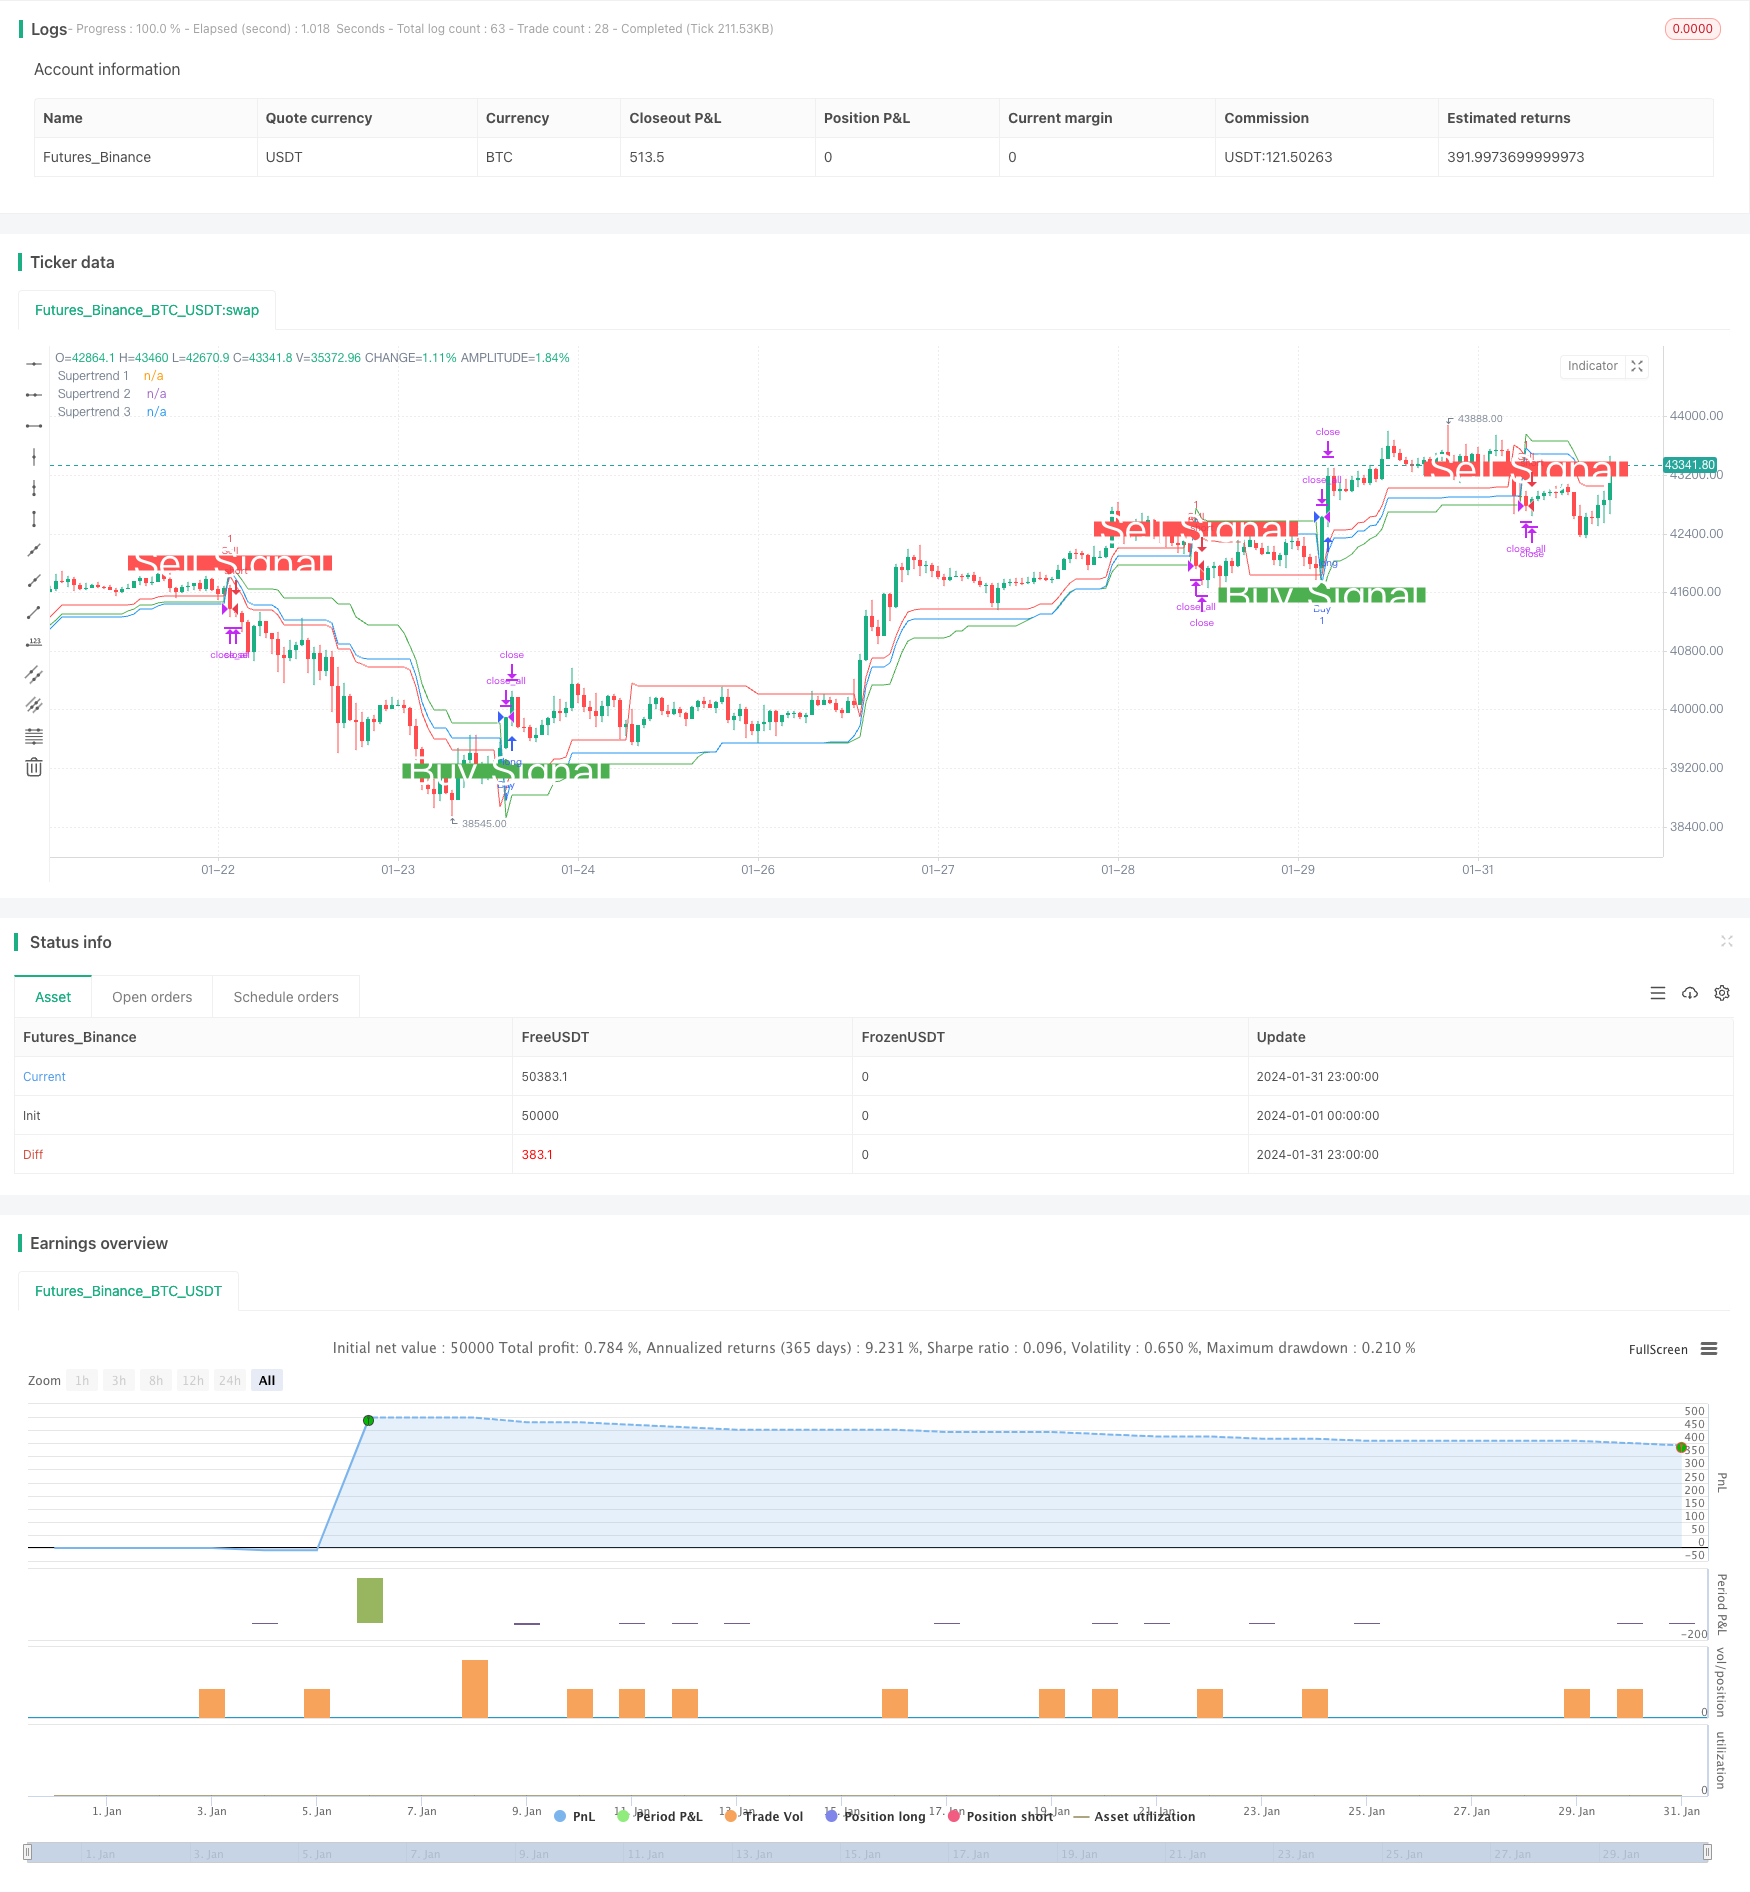
Strategi ini menggunakan fungsi ta.supertrend() untuk mengira indikator supertrend dengan tiga set parameter yang berbeza. Ia mengira supertrend ATR 3 kali ganda pada hari ke-10, supertrend ATR 2 kali ganda pada hari ke-14, supertrend 2 kali ganda pada hari ke-14, dan supertrend ATR 2.5 kali ganda pada hari ke-20 3 . Ia menghasilkan isyarat beli apabila harga melewati semua tiga supertrend. Ia menghasilkan isyarat jual apabila harga melewati semua tiga supertrend di bawah.
Indikator supertrend digabungkan dengan ATR untuk mengesan perubahan harga secara berkesan. Strategi supertrend tiga kali lipat menjadikan isyarat lebih dipercayai, sehingga memperoleh keuntungan yang lebih besar dalam keadaan trend.
Kelebihan Strategik
- Mekanisme penapisan tiga, mengelakkan isyarat palsu, meningkatkan kualiti isyarat
- Penunjuk Super Trend mempunyai fungsi penghapusan bunyi yang baik
- Pelbagai kombinasi parameter hyper boleh dikonfigurasikan untuk persekitaran pasaran yang lebih luas
- Tes sejarah menunjukkan prestasi yang baik, risiko berbanding keuntungan yang tinggi
Risiko Strategik
- Isyarat penapisan berganda mungkin terlepas beberapa peluang
- Tidak baik dalam keadaan gegaran
- Kombinasi tiga set parameter hyper yang perlu dioptimumkan
- Waktu perdagangan terpusat terdedah kepada kejadian mengejut
Untuk mengurangkan risiko, pertimbangkan perkara berikut:
- Menyesuaikan syarat penapisan untuk mengekalkan satu atau dua trend super
- Meningkatkan strategi hentikan kerugian
- Optimumkan parameter super untuk meningkatkan kadar kemenangan
Arah pengoptimuman strategi
- Uji lebih banyak kombinasi parameter untuk mencari superparameter terbaik
- Menambah algoritma pembelajaran mesin, parameter pengoptimuman masa nyata
- Meningkatkan strategi penangguhan kerugian dan mengawal kerugian tunggal
- Gabungan dengan penunjuk lain untuk mengenal pasti trend dan gegaran
- Memperluaskan masa dagangan untuk mengelakkan risiko nod masa tunggal
ringkaskan
Strategi ini membuat keputusan dengan tiga overlapping super trend, dapat mengenal pasti arah trend secara berkesan. Ia mempunyai kelebihan seperti kualiti isyarat yang tinggi, parameter yang boleh dioptimumkan. Di samping itu, terdapat risiko tertentu, perlu menyesuaikan parameter dan masa keluar untuk menyesuaikan diri dengan keadaan pasaran yang berbeza.
/*backtest
start: 2024-01-01 00:00:00
end: 2024-01-31 23:59:59
period: 1h
basePeriod: 15m
exchanges: [{"eid":"Futures_Binance","currency":"BTC_USDT"}]
*/

//@version=5
strategy('Combined Supertrend Strategy - Ajit Prasad', overlay=true)

// Function to calculate Supertrend
supertrendFunc(atrLength, factor) =>
    [supertrend, direction] = ta.supertrend(factor, atrLength)
    [supertrend, direction]

// Input parameters for the first Supertrend
atrPeriod1 = input(10, 'ATR Length 1')
factor1 = input(3, 'Factor 1')

// Calculate the first Supertrend
[supertrend1, direction1] = supertrendFunc(atrPeriod1, factor1)

// Input parameters for the second Supertrend
atrPeriod2 = input(14, 'ATR Length 2') // Change values as needed
factor2 = input(2, 'Factor 2') // Change values as needed

// Calculate the second Supertrend
[supertrend2, direction2] = supertrendFunc(atrPeriod2, factor2)

// Input parameters for the third Supertrend
atrPeriod3 = input(20, 'ATR Length 3') // Change values as needed
factor3 = input(2.5, 'Factor 3') // Change values as needed

// Calculate the third Supertrend
[supertrend3, direction3] = supertrendFunc(atrPeriod3, factor3)

// Define market opening and closing times
marketOpenHour = 9
marketOpenMinute = 15
marketCloseHour = 15
marketCloseMinute = 30
exitTimeHour = 15
exitTimeMinute = 10

// Fetch historical close values using security function
histClose = request.security(syminfo.tickerid, "D", close)

// Buy condition
buyCondition = close > supertrend1 and close > supertrend2 and close > supertrend3 and close[1] <= supertrend1[1]

// Sell condition
sellCondition = close < supertrend1 and close < supertrend2 and close < supertrend3 and close[1] >= supertrend1[1]

// Exit conditions
buyExitCondition = close < supertrend1[1] or close < supertrend2[1] or close < supertrend3[1]
sellExitCondition = close > supertrend1[1] or close > supertrend2[1] or close > supertrend3[1]

// Execute orders with market timing
if true
    // Buy condition without 'and not'
    strategy.entry('Buy', strategy.long, when = buyCondition)

    // Sell condition without 'and not'
    strategy.entry('Sell', strategy.short, when = sellCondition)

    // Close conditions
    strategy.close('Buy', when = buyExitCondition )
    strategy.close('Sell', when = sellExitCondition)

// Close all trades at 3:10 pm IST
if true
    strategy.close_all()

// Plot Supertrends
plot(supertrend1, 'Supertrend 1', color=color.new(color.green, 0), style=plot.style_linebr)
plot(supertrend2, 'Supertrend 2', color=color.new(color.red, 0), style=plot.style_linebr)
plot(supertrend3, 'Supertrend 3', color=color.new(color.blue, 0), style=plot.style_linebr)

// Plot labels
plotshape(buyCondition, style=shape.labelup, location=location.belowbar, color=color.new(color.green, 0), size=size.large, text='Buy Signal', textcolor=color.new(color.white, 0))
plotshape(sellCondition, style=shape.labeldown, location=location.abovebar, color=color.new(color.red, 0), size=size.large, text='Sell Signal', textcolor=color.new(color.white, 0))