Strategi Mutasi Trend Sejarah
Gambaran keseluruhan
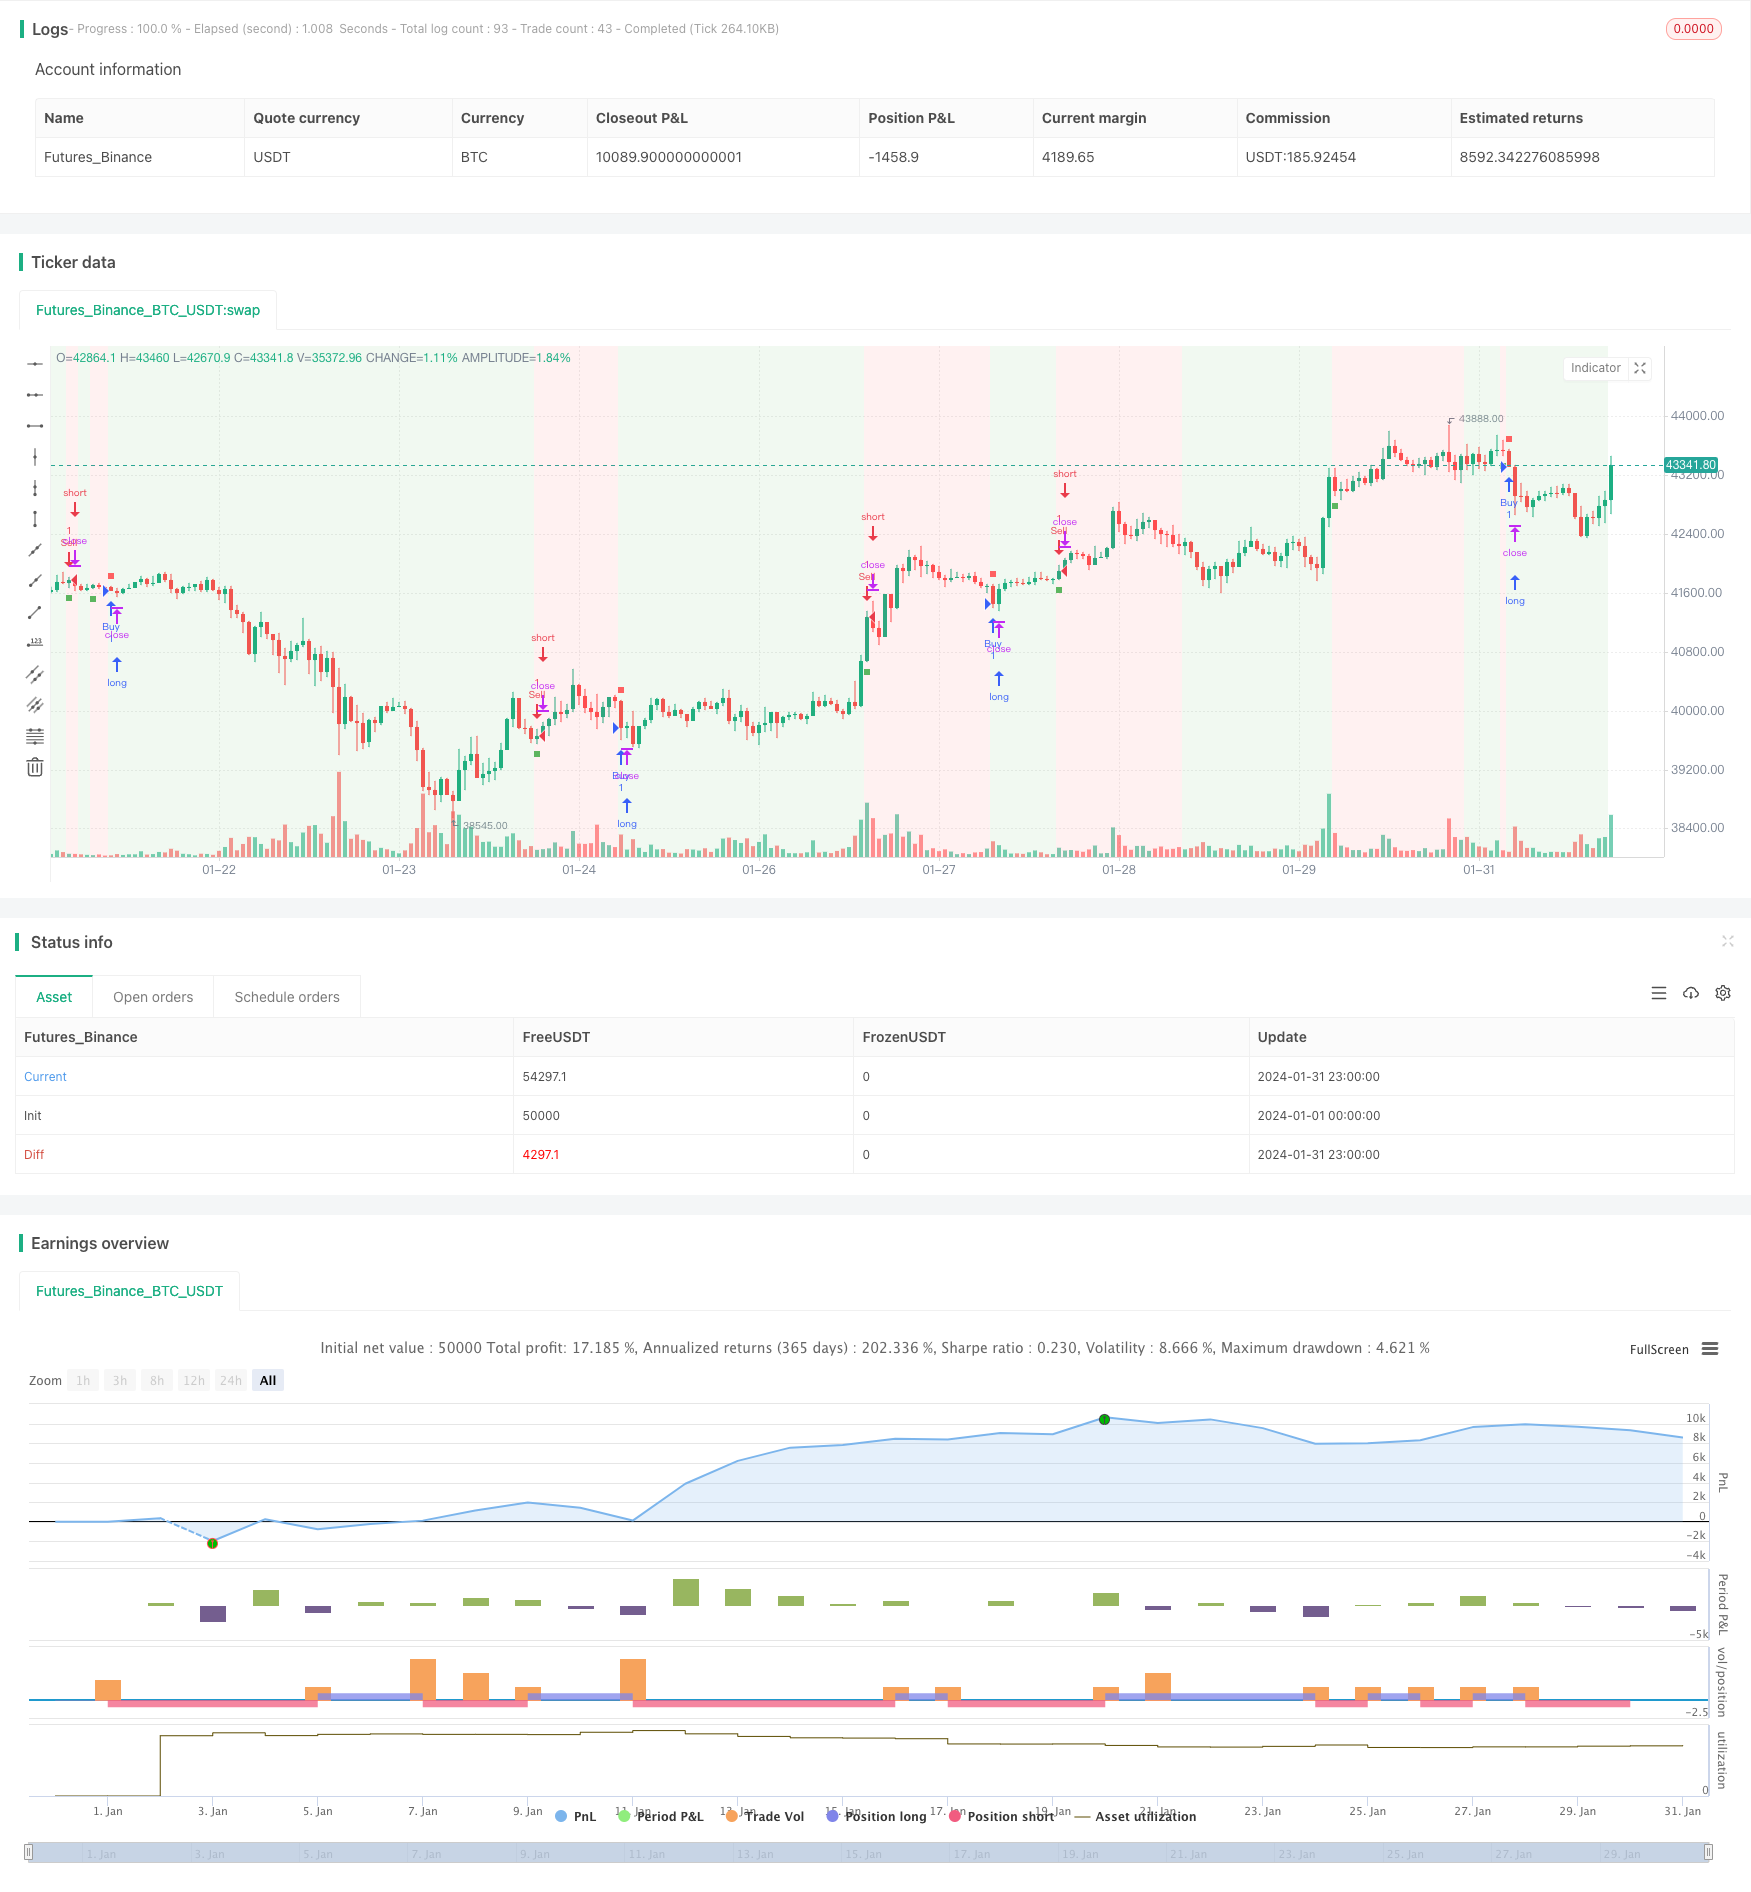
Strategi pemesanan trend sejarah menggunakan penunjuk aliran yang berputar untuk mengenal pasti titik perubahan trend pasaran, digabungkan dengan purata bergerak indeks untuk menghasilkan isyarat perdagangan yang bertujuan untuk menangkap favor. Strategi ini dengan cerdik menggabungkan kelebihan penggunaan penunjuk aliran yang berputar dan purata bergerak, dapat menentukan pergerakan pasaran dengan berkesan dan memberikan panduan perdagangan.
Pembahasan asal
Penunjuk aliran- Menentukan arah dan kekuatan trend dengan menganalisis pergerakan harga ke arah positif dan ke arah negatif. Parameter utama termasuk panjang kitaran, penggandaan dan nilai penurunan.
Purata bergerak indeks- Menghaluskan indeks pada harga penutupan, memberikan penghakiman trend yang lebih lancar. Semakin lama tempoh purata bergerak, semakin stabil penghakiman trend.
Strategi ini menggunakan penunjuk aliran riak untuk menentukan arah trend utama pasaran, menghasilkan isyarat perdagangan apabila garis penunjuk melintasi paras paras paras. Digabungkan dengan purata bergerak untuk memfilter dan mengelakkan isyarat salah. Secara khusus, menghasilkan isyarat beli apabila penunjuk aliran riak melintasi paras ke atas dan harga lebih tinggi daripada purata bergerak; menghasilkan isyarat jual apabila penunjuk aliran riak melintasi paras ke bawah dan harga lebih rendah daripada purata bergerak.
Analisis kelebihan
- Menggunakan kebolehan untuk mengesan pembalikan dalam penunjuk aliran, ia dapat menangkap peluang untuk membalikkan trend yang berpotensi
- Penapisan isyarat yang digabungkan dengan purata bergerak untuk mengelakkan perdagangan yang salah dalam keadaan goyah
- Keupayaan untuk menyesuaikan sensitiviti strategi untuk keadaan pasaran yang berbeza dengan mengoptimumkan parameter
- Antara muka yang intuitif dan isyarat perdagangan yang jelas, memudahkan operasi dalam talian
Analisis risiko
- Risiko sistem yang boleh menyebabkan kegagalan penunjuk dengan berjaga-jaga
- Lebih banyak isyarat yang salah boleh berlaku semasa gempa bumi
- Penetapan parameter yang tidak betul juga boleh menyebabkan terlalu radikal atau konservatif
- Perlu dilengkapi dengan halangan yang sesuai untuk mengawal kerugian tunggal
Risiko boleh ditangani dengan menambah penapis tambahan, penilaian pelbagai indikator, seting parameter yang dioptimumkan, dan menetapkan hentian yang sesuai.
Arah pengoptimuman
- Cuba pelbagai jenis purata bergerak untuk mencari kombinasi yang paling sesuai
- Menyesuaikan parameter penunjuk aliran tumpang tindih dan purata bergerak untuk mencapai kadar pulangan yang optimum
- Pemeriksaan kestabilan strategi pada tempoh masa yang berbilang
- Menambah penapis tanda seperti Brinks
- Penyesuaian parameter untuk varieti tertentu
ringkaskan
Strategi perubahan trend sejarah secara keseluruhan lebih kukuh, mempunyai kemampuan penapisan tertentu sambil menangkap pembalikan trend yang berpotensi. Dengan bantuan pengoptimuman parameter dan pengurusan risiko, strategi ini dijangka memperoleh kadar pulangan yang lebih baik.
/*backtest
start: 2024-01-01 00:00:00
end: 2024-01-31 23:59:59
period: 1h
basePeriod: 15m
exchanges: [{"eid":"Futures_Binance","currency":"BTC_USDT"}]
*/

// This work is licensed under a Attribution-NonCommercial-ShareAlike 4.0 International (CC BY-NC-SA 4.0) https://creativecommons.org/licenses/by-nc-sa/4.0/
// © AstroHub

//@version=5
strategy("Vortex Strategy [AstroHub]", shorttitle="VS [AstroHub]", overlay=true)

// Vortex Indicator Settings
length = input(14, title="Length", group ="AstroHub Vortex Strategy", tooltip="Number of bars used in the Vortex Indicator calculation. Higher values may result in smoother but slower responses to price changes.")
mult = input(1.0, title="Multiplier", group ="AstroHub Vortex Strategy", tooltip="Multiplier for the Vortex Indicator calculation. Adjust to fine-tune the sensitivity of the indicator to price movements.")
threshold = input(0.5, title="Threshold",group ="AstroHub Vortex Strategy",  tooltip="Threshold level for determining the trend. Higher values increase the likelihood of a trend change being identified.")
emaLength = input(20, title="EMA Length", group ="AstroHub Vortex Strategy", tooltip="Length of the Exponential Moving Average (EMA) used in the strategy. A longer EMA may provide a smoother trend indication.")

// Calculate Vortex Indicator components
a = math.abs(close - close[1])
b = close - ta.sma(close, length)
shl = ta.ema(b, length)
svl = ta.ema(a, length)

// Determine trend direction
upTrend = shl > svl
downTrend = shl < svl

// Define Buy and Sell signals
buySignal = ta.crossover(shl, svl) and close > ta.ema(close, emaLength) and (upTrend != upTrend[1])
sellSignal = ta.crossunder(shl, svl) and close < ta.ema(close, emaLength) and (downTrend != downTrend[1])

// Execute strategy based on signals
strategy.entry("Sell", strategy.short, when=buySignal)
strategy.entry("Buy", strategy.long, when=sellSignal)

// Background color based on the trend
bgcolor(downTrend ? color.new(color.green, 90) : upTrend ? color.new(color.red, 90) : na)

// Plot Buy and Sell signals with different shapes and colors
buySignal1 = ta.crossover(shl, svl) and close > ta.ema(close, emaLength)
sellSignal1 = ta.crossunder(shl, svl) and close < ta.ema(close, emaLength)

plotshape(buySignal1, style=shape.square, color=color.new(color.green, 10), size=size.tiny, location=location.belowbar, title="Buy Signal")
plotshape(sellSignal1, style=shape.square, color=color.new(color.red, 10), size=size.tiny, location=location.abovebar, title="Sell Signal")
plotshape(buySignal1, style=shape.square, color=color.new(color.green, 90), size=size.small, location=location.belowbar, title="Buy Signal")
plotshape(sellSignal1, style=shape.square, color=color.new(color.red, 90), size=size.small, location=location.abovebar, title="Sell Signal")