Arah aliran bingkai berbilang masa mengikut strategi berdasarkan rintangan sokongan dan penunjuk momentum
Gambaran Keseluruhan Strategi
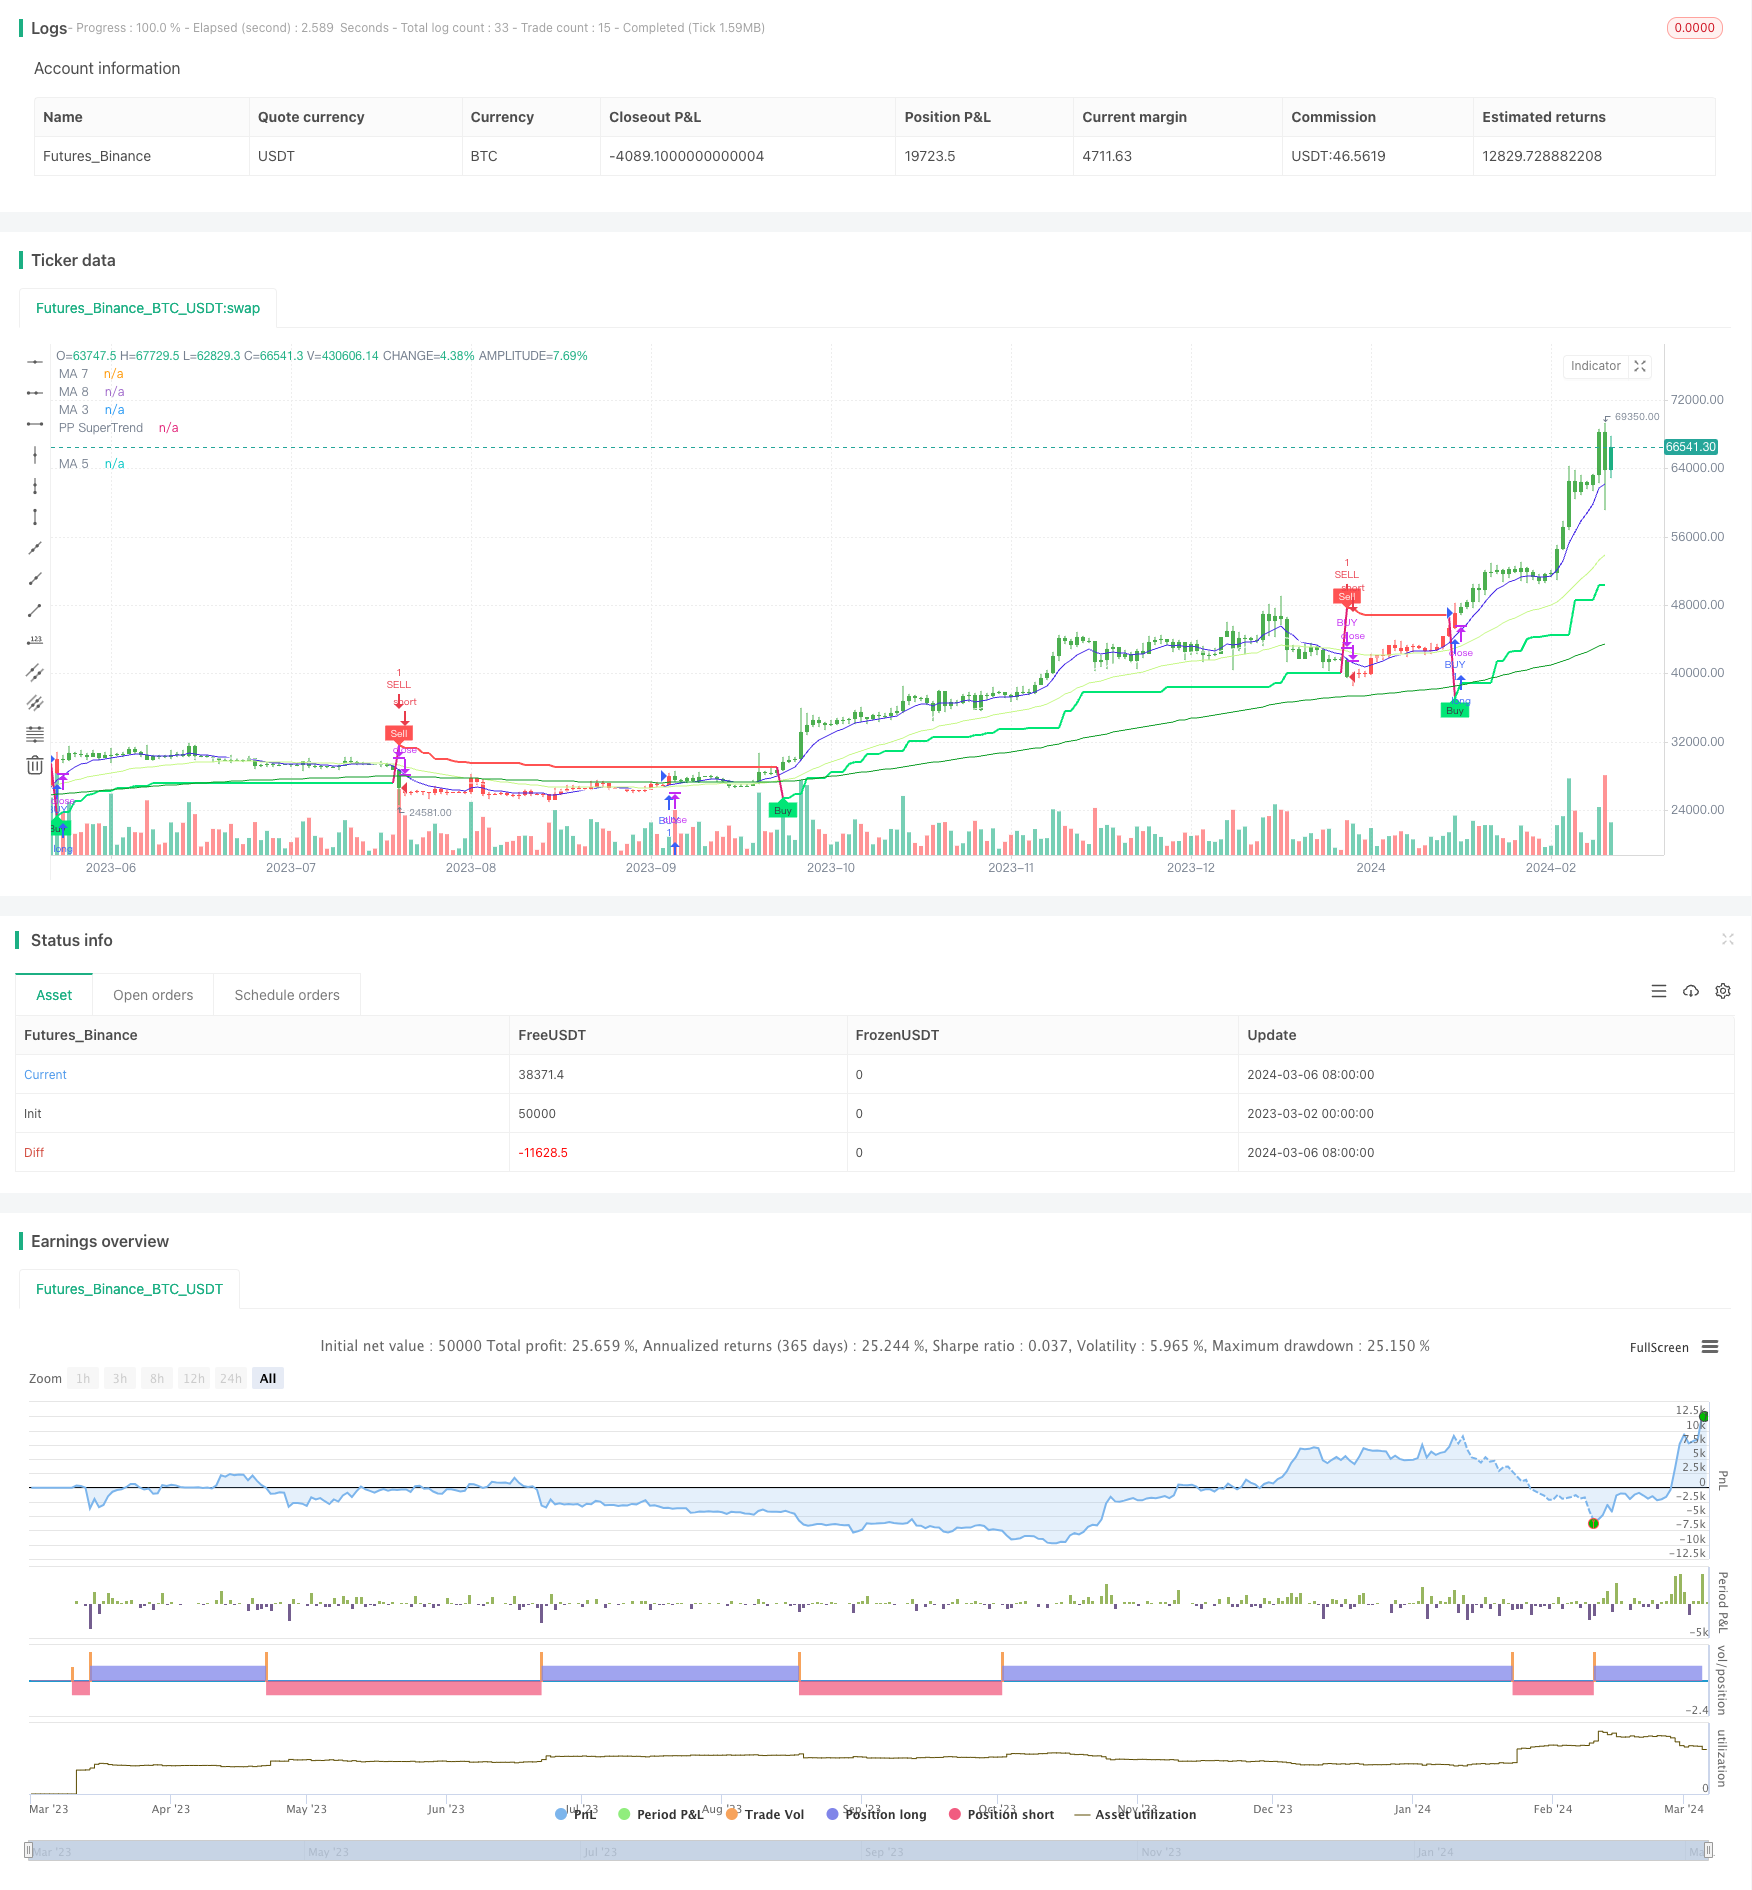
Strategi ini menggabungkan beberapa petunjuk teknikal seperti tahap rintangan sokongan, indikator tren super dan purata bergerak untuk menilai arah trend secara menyeluruh pada pelbagai bingkai masa, mewujudkan sistem perdagangan yang mengikuti trend. Gagasan utama strategi ini adalah: pertama menggunakan titik-titik pivot untuk menentukan kedudukan rintangan sokongan harga semasa, kemudian menggunakan indikator tren super untuk menentukan arah trend semasa, dan terakhir menggunakan penapis rata-rata bergerak untuk menyimpang dari keadaan.
Prinsip Strategi
- Pertama, kira titik teras berdasarkan harga tertinggi dan terendah dalam tempoh tertentu yang lalu, dan dapatkan tahap rintangan sokongan harga semasa.
- Menggunakan indikator Supertrend untuk menilai trend. Supertrend dikira oleh rintangan sokongan dinamik, merupakan indikator trend.
- Menggunakan ATR Stop. Strategi ini menambah ATR sebagai stop loss berdasarkan trend super asal.
- Filter trend menggunakan purata bergerak. Hanya apabila trend meningkat dan harga di atas garis purata, dan trend menurun dan harga di bawah garis purata.
- Tetapkan tetingkap masa dagangan. Hanya buka kedudukan dalam tempoh masa tertentu, untuk mengelakkan dagangan pada waktu penting.
- Posisi berbilang kosong dikendalikan secara berasingan. Isyarat berbilang dan kosong masing-masing mencetuskan logik pembukaan kedudukan masing-masing.
Kesimpulannya, strategi ini membuka kedudukan apabila tiga syarat beresonansi di titik-titik utama yang menyokong rintangan, arah super trend, dan arah garis rata, mana-mana syarat yang gagal adalah kedudukan rata. Ini secara berkesan menangkap trend, dan mengawal risiko.
Analisis kelebihan
- Perdagangan berdasarkan sokongan titik rintangan mempunyai kelebihan yang sesuai dengan undang-undang permintaan dan bekalan pasaran, dan titik pivot dapat bertindak balas secara dinamik terhadap keseimbangan pasaran.
- Supertrend mampu menangkap trend dengan berkesan dan menghentikan kerugian tepat pada masanya.
- Penapisan garis rata mengelakkan perdagangan berlawanan. Bermain apabila trend dan garis rata beresonansi, peluang menang akan lebih tinggi.
- Tetingkap masa dagangan tersuai mengelakkan dagangan pada masa-masa penting seperti sebelum buka dan tutup.
- Isyarat berbilang kepala dan kosong beroperasi secara berasingan, dan boleh memegang banyak kedudukan kosong pada masa yang sama, untuk memanfaatkan peluang pasaran dengan lebih lengkap.
Analisis risiko
- Risiko perdagangan yang kerap. Strategi ini boleh menyebabkan terlalu banyak kos perdagangan dengan sering membuka posisi kosong di pasaran yang bergolak.
- Walaupun strategi ini menggunakan penapis garis rata, ia masih boleh berlaku jika garis rata itu sendiri bertentangan dengan trend besar.
- Masalah pengoptimuman parameter. Strategi mengandungi banyak parameter, seperti kitaran dan penggandaan trend super, kitaran rata-rata, dan sebagainya. Perbezaan parameter akan menghasilkan hasil yang berbeza, bagaimana memilih kombinasi parameter yang optimum adalah cabaran.
- Strategi ini mungkin tidak dapat dihentikan dalam masa yang tepat dalam keadaan yang melampau, seperti kejatuhan ribut, krisis kecairan, dan sebagainya.
Arah pengoptimuman
- Memperkenalkan lebih banyak garis rata-rata jangka menengah dan panjang, meningkatkan kebolehpercayaan penilaian trend, dan mengurangkan perdagangan yang kerap.
- Pengenalan penunjuk turun naik, seperti Brinband, boleh dipertimbangkan untuk mengurangkan perdagangan di pasaran turun naik yang tinggi.
- Mengoptimumkan parameter untuk mencari kombinasi parameter yang terbaik dan meningkatkan kestabilan strategi.
- Menetapkan hentian keras dan mengawal risiko dalam keadaan yang melampau. Di samping itu, pertimbangan boleh dimasukkan ke dalam penilaian turun naik pasaran yang luar biasa, seperti harga melompat, lonjakan jumlah transaksi, dan lain-lain, untuk mengurangkan atau menghentikan perdagangan apabila berlaku sesuatu yang luar biasa.
ringkaskan
Strategi ini mengintegrasikan pelbagai kaedah analisis teknikal seperti sokongan rintangan, pengesanan trend, penapisan momentum, dan lain-lain yang dapat menghasilkan keuntungan yang berkesan dalam keadaan trend, sambil mengawal risiko penarikan balik. Kelebihannya adalah bahawa isyaratnya jelas, ringkas, logiknya jelas, dan sesuai untuk digunakan dalam jangka masa yang sederhana. Walau bagaimanapun, strategi ini juga mempunyai masalah seperti perdagangan yang kerap, kesukaran pengoptimuman parameter, kawalan risiko yang kurang dalam keadaan yang melampau.
/*backtest
start: 2023-03-02 00:00:00
end: 2024-03-07 00:00:00
period: 1d
basePeriod: 1h
exchanges: [{"eid":"Futures_Binance","currency":"BTC_USDT"}]
*/

//@rpcoelho
// Based on © Julien_Eche "Pivot Point Supertrend" with optional EMAs ploted
//@version=4

strategy("PPS w/ EMAs", overlay=true)

prd = input(defval = 1, title="Pivot Point Period", minval = 1, maxval = 50)
Factor=input(defval = 4, title = "ATR Factor", minval = 1, step = 0.1)
Pd=input(defval = 72, title = "ATR Period", minval=1)
showpivot = input(defval = false, title="Show Pivot Points")
showlabel = input(defval = true, title="Show Buy/Sell Labels")
showcl = input(defval = false, title="Show PP Center Line")
showsr = input(defval = false, title="Show Support/Resistance")

/////////////////////////////////////////////////////////////////////////
// Switch Board
////////////////////////////////////////////////////////////////////////
// Define the switch board title as a label (since grouping is not available)
//switchboard_group = "████ Switch Board (Turn On/Off Overlay Indicators) ████"
//label.new(bar_index, high, switchboard_group, color=color.red)
// Create input controls for EMA and VWAP switches
switch_ema = input(true, title="EMA")

/////////////////////////////////////////////////////////////////////////
// EMA Selection
////////////////////////////////////////////////////////////////////////

ma_function(source, length, type) =>
    float ma = na
    if type == 'RMA'
        ma := rma(source, length)
    else if type == 'SMA'
        ma := sma(source, length)
    else if type == 'EMA'
        ma := ema(source, length)
    else if type == 'WMA'
        ma := wma(source, length)
    else if type == 'HMA'
        ma := length < 2 ? hma(source, 2) : hma(source, length)
    else
        ma := vwma(source, length)
    ma

// Moving Averages Line Title
//ma_group = "██████████ MAs Line ██████████"

// Inputs for MA 1
len1bool = input(false, title="Show MA 1")
len1 = input(13, title="Length MA 1")
ma_1_type = input("EMA", title="Type MA 1", options=["RMA", "SMA", "EMA", "WMA", "HMA", "VWMA"])
src_ma1 = input(title="MA1 Source", type=input.source, defval=close)
ma_1_colour = input(color.rgb(235, 159, 238), title="Color MA 1")

// Inputs for MA 2
len2bool = input(false, title="Show MA 2")
len2 = input(17, title="Length MA 2")
ma_2_type = input("EMA", title="Type MA 2", options=["RMA", "SMA", "EMA", "WMA", "HMA", "VWMA"])
src_ma2 = input(title="MA2 Source", type=input.source, defval=close)
ma_2_colour = input(color.rgb(230, 241, 65), title="Color MA 2")

// Inputs for MA 3
len3bool = input(true, title="Show MA 3")
len3 = input(34, title="Length MA 3")
ma_3_type = input("EMA", title="Type MA 3", options=["RMA", "SMA", "EMA", "WMA", "HMA", "VWMA"])
src_ma3 = input(title="MA3 Source", type=input.source, defval=close)
ma_3_colour = input(#c7f887, title="Color MA 3")

// Inputs for MA 4
len4bool = input(false, title="Show MA 4")
len4 = input(72, title="Length MA 4")
ma_4_type = input("EMA", title="Type MA 4", options=["RMA", "SMA", "EMA", "WMA", "HMA", "VWMA"])
src_ma4 = input(title="MA4 Source", type=input.source, defval=close)
ma_4_colour = input(#2f6999, title="Color MA 4")

// Inputs for MA 5
len5bool = input(true, title="Show MA 5")
len5 = input(144, title="Length MA 5")
ma_5_type = input("EMA", title="Type MA 5", options=["RMA", "SMA", "EMA", "WMA", "HMA", "VWMA"])
src_ma5 = input(title="MA5 Source", type=input.source, defval=close)
ma_5_colour = input(color.rgb(13, 156, 37), title="Color MA 5")

// Inputs for MA 6
len6bool = input(true, title="Show MA 6")
len6 = input(610, title="Length MA 6")
ma_6_type = input("EMA", title="Type MA 6", options=["RMA", "SMA", "EMA", "WMA", "HMA", "VWMA"])
src_ma6 = input(title="MA6 Source", type=input.source, defval=close)
ma_6_colour = input(color.rgb(173, 161, 152), title="Color MA 6")

// Inputs for MA 7
len7bool = input(true, title="Show MA 7")
len7 = input(8, title="Length MA 7")
ma_7_type = input("EMA", title="Type MA 7", options=["RMA", "SMA", "EMA", "WMA", "HMA", "VWMA"])
src_ma7 = input(title="MA7 Source", type=input.source, defval=close)
ma_7_colour = input(color.rgb(68, 39, 231), title="Color MA 7")

// Inputs for MA 8
len8bool = input(true, title="Show MA 8")
len8 = input(21, title="Length MA 8")
ma_8_type = input("EMA", title="Type MA 8", options=["RMA", "SMA", "EMA", "WMA", "HMA", "VWMA"])
src_ma8 = input(title="MA8 Source", type=input.source, defval=close)
ma_8_colour = input(color.white, title="Color MA 8")

ema1 = security(syminfo.tickerid, timeframe.period, ma_function(src_ma1, len1, ma_1_type))
ema2 = security(syminfo.tickerid, timeframe.period, ma_function(src_ma2, len2, ma_2_type))
ema3 = security(syminfo.tickerid, timeframe.period, ma_function(src_ma3, len3, ma_3_type))
ema4 = security(syminfo.tickerid, timeframe.period, ma_function(src_ma4, len4, ma_4_type))
ema5 = security(syminfo.tickerid, timeframe.period, ma_function(src_ma5, len5, ma_5_type))
ema6 = security(syminfo.tickerid, timeframe.period, ma_function(src_ma6, len6, ma_6_type))
ema7 = security(syminfo.tickerid, timeframe.period, ma_function(src_ma7, len7, ma_7_type))
ema8 = security(syminfo.tickerid, timeframe.period, ma_function(src_ma8, len8, ma_8_type))

plot(len1bool and switch_ema ? ema1:na, color=ma_1_colour, linewidth=1, title='MA 1')
plot(len2bool and switch_ema? ema2:na, color=ma_2_colour, linewidth=1, title='MA 2')
plot(len3bool and switch_ema? ema3:na, color=ma_3_colour, linewidth=1, title='MA 3')
plot(len4bool and switch_ema? ema4:na, color=ma_4_colour, linewidth=1, title='MA 4')
plot(len5bool and switch_ema? ema5:na, color=ma_5_colour, linewidth=1, title='MA 5')
plot(len6bool and switch_ema? ema6:na, color=ma_6_colour, linewidth=2, title='MA 6')
plot(len7bool and switch_ema? ema7:na, color=ma_7_colour, linewidth=1, title='MA 7')
plot(len8bool and switch_ema? ema8:na, color=ma_8_colour, linewidth=1, title='MA 8')


// get Pivot High/Low
float ph = pivothigh(prd, prd)
float pl = pivotlow(prd, prd)

// drawl Pivot Points if "showpivot" is enabled
plotshape(ph and showpivot, text="H",  style=shape.labeldown, color=na, textcolor=color.red, location=location.abovebar, transp=0, offset = -prd)
plotshape(pl and showpivot, text="L",  style=shape.labeldown, color=na, textcolor=color.lime, location=location.belowbar, transp=0, offset = -prd)

// calculate the Center line using pivot points
var float center = na
float lastpp = ph ? ph : pl ? pl : na
if lastpp
    if na(center)
        center := lastpp
    else
        //weighted calculation
        center := (center * 2 + lastpp) / 3

// upper/lower bands calculation
Up = center - (Factor * atr(Pd))
Dn = center + (Factor * atr(Pd))

// get the trend
float TUp = na
float TDown = na
Trend = 0
TUp := close[1] > TUp[1] ? max(Up, TUp[1]) : Up
TDown := close[1] < TDown[1] ? min(Dn, TDown[1]) : Dn
Trend := close > TDown[1] ? 1: close < TUp[1]? -1: nz(Trend[1], 1)
Trailingsl = Trend == 1 ? TUp : TDown

// plot the trend
linecolor = Trend == 1 and nz(Trend[1]) == 1 ? color.lime : Trend == -1 and nz(Trend[1]) == -1 ? color.red : na
plot(Trailingsl, color = linecolor ,  linewidth = 2, title = "PP SuperTrend")

plot(showcl ? center : na, color = showcl ? center < hl2 ? color.blue : color.red : na)

// check and plot the signals
bsignal = Trend == 1 and Trend[1] == -1
ssignal = Trend == -1 and Trend[1] == 1
plotshape(bsignal and showlabel ? Trailingsl : na, title="Buy", text="Buy", location = location.absolute, style = shape.labelup, size = size.tiny, color = color.lime, textcolor = color.black, transp = 0)
plotshape(ssignal and showlabel ? Trailingsl : na, title="Sell", text="Sell", location = location.absolute, style = shape.labeldown, size = size.tiny, color = color.red, textcolor = color.white, transp = 0)

//get S/R levels using Pivot Points
float resistance = na
float support = na
support := pl ? pl : support[1]
resistance := ph ? ph : resistance[1]

// if enabled then show S/R levels
plot(showsr and support ? support : na, color = showsr and support ? color.lime : na, style = plot.style_circles, offset = -prd)
plot(showsr and resistance ? resistance : na, color = showsr and resistance ? color.red : na, style = plot.style_circles, offset = -prd)

// Trend Filter from SuperTrend Long Strategy
Periods = input(title="ATR Period", type=input.integer, defval=3)
src = input(hlc3, title="Source")
Multiplier = input(title="ATR Multiplier", type=input.float, step=0.1, defval=4.0)
changeATR = input(title="Change ATR Calculation Method ?", type=input.bool, defval=true)

// Combine the SuperTrend calculations
atr2 = sma(tr, Periods)
atr = changeATR ? atr(Periods) : atr2

up = src - (Multiplier * atr)
up1 = nz(up[1], up)
up := close[1] > up1 ? max(up, up1) : up

dn = src + (Multiplier * atr)
dn1 = nz(dn[1], dn)
dn := close[1] < dn1 ? min(dn, dn1) : dn

trend = 1
trend := nz(trend[1], trend)
trend := trend == -1 and close > dn1 ? 1 : trend == 1 and close < up1 ? -1 : trend

// Moving Average as Trend Filter
periodes_ma = input(title="Moving Average Period", type=input.integer, defval=20)
src_ma = input(title="Moving Average Source", type=input.source, defval=close)
ma = sma(src_ma, periodes_ma)

// Strategy Entry Conditions
FromMonth = input(defval = 1, title = "From Month", minval = 1, maxval = 12)
FromDay   = input(defval = 1, title = "From Day", minval = 1, maxval = 31)
FromYear  = input(defval = 2017, title = "From Year", minval = 999)
ToMonth   = input(defval = 1, title = "To Month", minval = 1, maxval = 12)
ToDay     = input(defval = 1, title = "To Day", minval = 1, maxval = 31)
ToYear    = input(defval = 9999, title = "To Year", minval = 999)

start     = timestamp(FromYear, FromMonth, FromDay, 00, 00)
finish    = timestamp(ToYear, ToMonth, ToDay, 23, 59)

window()  => true

// Combined entry conditions
longCondition = (trend == 1 and trend[1] == -1 and close > ma) or (bsignal and window())
shortCondition = (trend == -1 and trend[1] == 1 and close < ma) or (ssignal and window())

if (longCondition)
    strategy.entry("BUY", strategy.long)

if (shortCondition)
    strategy.close("BUY")
    strategy.entry("SELL", strategy.short)

buy1 = barssince((trend == 1 and trend[1] == -1 and close > ma) or (bsignal and window()))
sell1 = barssince((trend == -1 and trend[1] == 1 and close < ma) or (ssignal and window()))
color1 = buy1[1] < sell1[1] ? color.green : buy1[1] > sell1[1] ? color.red : na
barcolor(color1)