Strategi Kawalan Risiko Berdasarkan Super Trend dan MACD

Gambaran keseluruhan
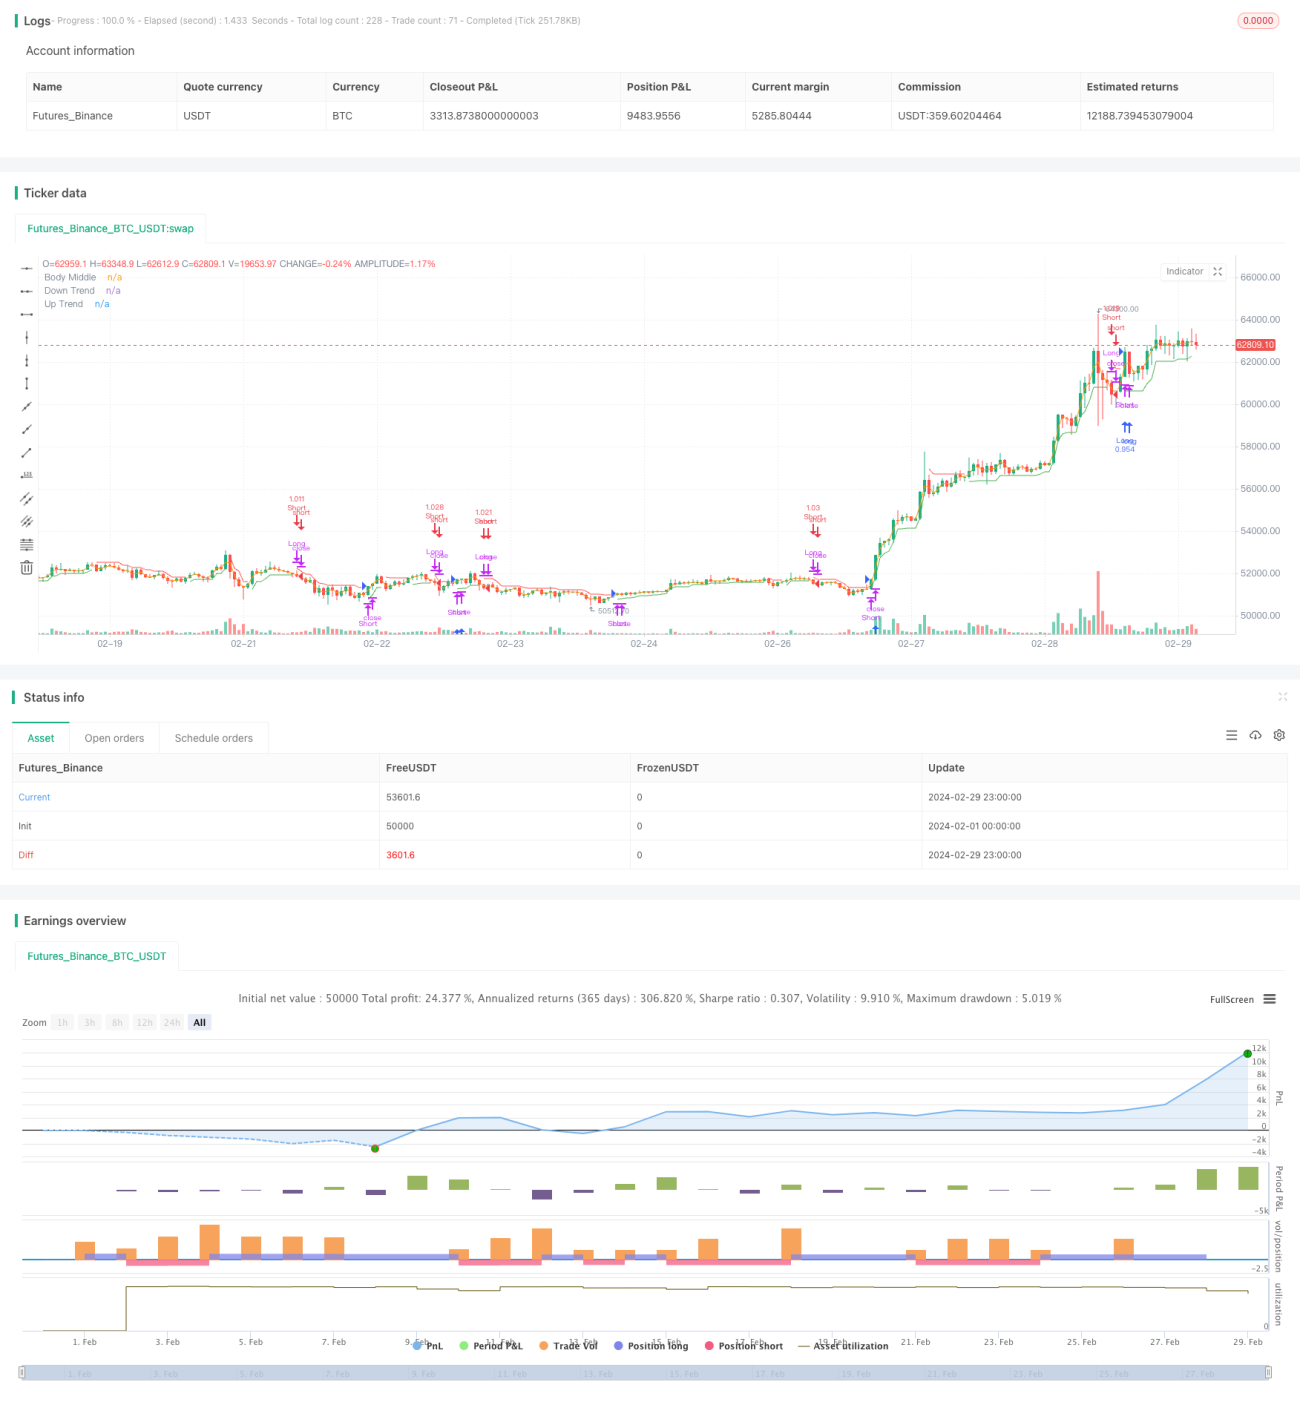
Strategi ini menggabungkan indikator supertrend dan MACD untuk mendapatkan keuntungan dengan menangkap trend kecil. Strategi ini menggunakan indikator supertrend untuk menilai trend pasaran semasa, sambil menggunakan indikator MACD sebagai syarat tambahan untuk masuk dan keluar.
Prinsip Strategi
- Fungsi ta.supertrend digunakan untuk mengira indikator supertrend dengan parameter ATR dan faktor pengganda.
- Trend multirole dinilai berdasarkan perubahan arah dalam indikator trend super, apabila arah berubah dari lebih besar daripada 0 menjadi kurang daripada sama dengan 0, ia dianggap sebagai trend naik; sebaliknya, ia dianggap sebagai trend menurun.
- Menggunakan fungsi request.security untuk mendapatkan nilai penunjuk MACD dalam kitaran 30 minit, termasuk garis MACD, garis isyarat dan carta tiang.
- Dalam trend ke atas, jika MACD lebih besar daripada 0, anda boleh membuka lebih banyak kedudukan dan menghapuskan kedudukan kosong sebelumnya.
- Dalam trend turun, jika MACD kurang daripada 0, anda boleh membuka kedudukan kosong dan juga melonggarkan kedudukan yang lebih tinggi.
Analisis kelebihan
- Gabungan trend tracking dan indikator momentum membolehkan anda menyesuaikan diri dengan keadaan pasaran yang berbeza.
- Menggunakan indikator MACD yang lebih lama sebagai syarat tambahan, ia dapat menyaring beberapa isyarat palsu dengan berkesan.
- Strategi logiknya mudah difahami, mudah difahami dan dilaksanakan, sesuai untuk pelajar pemula.
- Parameter strategi boleh disesuaikan dan boleh dioptimumkan mengikut pasaran dan varieti yang berbeza.
Analisis risiko
- Strategi: Lebih banyak isyarat dagangan mungkin berlaku dalam pasaran yang bergolak, yang menyebabkan lebih banyak dagangan dan kos slippage yang tinggi.
- Indeks Super Trend lebih sensitif terhadap parameter, dan parameter yang berbeza mungkin memberikan hasil yang berbeza.
- Indeks MACD mungkin berlaku dalam keadaan yang tidak selaras dengan harga, menyebabkan isyarat perdagangan yang salah.
- Strategi kekurangan langkah-langkah untuk menghentikan kerugian, yang mungkin membawa risiko yang lebih besar jika keadaan tidak stabil atau berlaku secara tiba-tiba.
Arah pengoptimuman
- Untuk meningkatkan kebolehpercayaan isyarat, lebih banyak syarat penapis boleh dipertimbangkan, seperti harga menembusi sokongan atau rintangan penting, perubahan jumlah perdagangan, dan sebagainya.
- Untuk pasaran goyah, anda boleh mempertimbangkan untuk menggunakan indikator MACD yang lebih pendek atau indikator lain yang sesuai untuk pasaran goyah untuk menilai trend.
- Langkah-langkah hentikan kerugian, seperti hentikan titik tetap, hentikan bergerak, dan lain-lain boleh ditambah untuk mengawal risiko maksimum dalam satu perdagangan.
- Anda boleh mengoptimumkan parameter untuk pasaran dan varieti yang berbeza untuk mencari kombinasi parameter yang paling sesuai.
ringkaskan
Strategi ini adalah strategi yang lebih komprehensif dan seimbang dengan menggabungkan indikator supertrend dan indikator MACD, yang juga mempertimbangkan kesinambungan trend sambil menangkap trend kecil. Kelebihan strategi ini adalah jelas logiknya, mudah difahami dan dilaksanakan, dan dengan menggunakan indikator MACD yang lebih lama sebagai syarat tambahan, beberapa isyarat palsu dapat disaring dengan berkesan. Tetapi strategi ini juga mempunyai beberapa risiko, seperti kemungkinan perdagangan yang kerap dalam pasaran yang bergolak, lebih sensitif terhadap parameter, dan kurangnya langkah-langkah berhenti.
- 1