TrendHunter w/MF Strategi Trend Pelbagai Jangka Masa

Gambaran Keseluruhan
Strategi TrendHunter w/MF Multi-Timeframe Trend adalah strategi menjejak arah aliran yang berdasarkan kepada pelbagai penunjuk teknikal dan analisis pelbagai rangka masa. Strategi ini mengambil kira faktor-faktor seperti Ichimoku Cloud, Moving Average, SuperTrend, WaveTrend, dan Money Flow, serta menentukan titik masuk melalui syarat yang ketat untuk menangkap arah aliran utama pasaran.
Prinsip Strategi
Prinsip teras strategi ini adalah berdasarkan analisis komprehensif pelbagai penunjuk teknikal pada pelbagai rangka masa. Secara khusus:
-
Ichimoku Cloud: Menentukan arah aliran pasaran semasa dengan menganalisis kedudukan relatif harga dan Moving Average terhadap awan. Apabila harga berada di atas awan dan Moving Average juga di atas awan, ia dianggap arah aliran menaik; sebaliknya dianggap arah aliran menurun.
-
SuperTrend: Mengesahkan arah aliran pasaran semasa dengan menganalisis kedudukan relatif harga terhadap SuperTrend. Apabila harga berada di atas SuperTrend, ia dianggap arah aliran menaik; sebaliknya dianggap arah aliran menurun.
-
WaveTrend: Menentukan arah aliran pasaran semasa dengan menganalisis arah dan kedudukan penunjuk WaveTrend. Apabila WaveTrend menaik dan belum mencapai zon terlebih beli, ia dianggap arah aliran menaik; apabila WaveTrend menurun dan belum mencapai zon terlebih jual, ia dianggap arah aliran menurun.
-
Money Flow: Mengesahkan arah aliran pasaran semasa dengan menganalisis status penunjuk Money Flow. Apabila Money Flow positif, ia dianggap arah aliran menaik; sebaliknya dianggap arah aliran menurun.
Semasa mengambil posisi beli, strategi memerlukan harga di atas awan, Moving Average di atas awan, SuperTrend menaik, WaveTrend menaik dan belum mencapai zon terlebih beli, serta Money Flow positif. Posisi jual adalah sebaliknya. Penapisan ketat pelbagai penunjuk dan pelbagai rangka masa ini dapat mengelakkan perdagangan yang kerap dalam pasaran yang tidak menentu, seterusnya meningkatkan kestabilan dan kebolehpercayaan strategi.
Analisis Kelebihan
-
Penilaian Komprehensif Pelbagai Penunjuk, Kebolehpercayaan Tinggi: Strategi ini mengambil kira pelbagai penunjuk teknikal yang saling melengkapi dalam keadaan pasaran yang berbeza, mencerminkan arah aliran pasaran secara menyeluruh, mengelakkan kesilapan yang mungkin berlaku dengan hanya satu penunjuk.
-
Syarat Kemasukan Ketat, Mengelakkan Perdagangan Kerap: Strategi menetapkan syarat kemasukan yang ketat; semua penunjuk mesti dipenuhi serentak untuk memasuki pasaran, ini berkesan mengelakkan perdagangan kerap dalam pasaran yang tidak menentu, mengurangkan kos strategi.
-
Analisis Pelbagai Rangka Masa, Menangkap Arah Aliran Besar: Strategi menganalisis pada pelbagai rangka masa, membantu strategi menangkap arah aliran utama pasaran dari perspektif yang lebih luas, mengelakkan gangguan bunyi jangka pendek.
-
Strategi Henti Rugi Jelas, Risiko Terkawal: Strategi menggunakan SuperTrend sebagai syarat henti rugi. Apabila arah aliran pasaran berubah, strategi boleh menghenti rugi tepat pada masanya, mengehadkan kerugian dalam julat yang boleh diterima.
Analisis Risiko
-
Kekurangan Pelarasan Dinamik, Keupayaan Terhad untuk Menyesuaikan dengan Perubahan Pasaran: Parameter strategi ini adalah tetap, tanpa keupayaan untuk menyesuaikan secara dinamik mengikut keadaan pasaran. Apabila keadaan pasaran berubah secara ketara, strategi mungkin menjadi tidak berkesan.
-
Syarat Kemasukan Terlalu Ketat, Mungkin Terlepas Peluang Baik: Syarat kemasukan strategi sangat ketat, walaupun ini mengelakkan perdagangan kerap, ia juga boleh menyebabkan strategi terlepas beberapa peluang kemasukan yang baik.
-
Kebolehsuaian Terhadap Keadaan Pasaran Melampau Tidak Diketahui: Strategi berprestasi baik dalam keadaan pasaran biasa, tetapi kebolehsuaian terhadap keadaan pasaran melampau seperti perubahan pantas dan besar masih perlu diuji.
-
Strategi Henti Rugi Agak Mudah, Mempunyai Ruang Pengoptimuman: Pada masa ini, strategi hanya menggunakan SuperTrend sebagai syarat henti rugi. Walaupun ini mudah dan jelas, strategi henti rugi masih boleh dioptimumkan lanjut untuk mengawal risiko dengan lebih baik.
Hala Tuju Pengoptimuman
-
Memperkenalkan Penilaian Keadaan Pasaran, Melaraskan Parameter Secara Dinamik: Boleh mempertimbangkan untuk memperkenalkan penunjuk penilaian keadaan pasaran seperti penunjuk volatiliti, dan melaraskan parameter strategi secara dinamik mengikut perubahan keadaan pasaran untuk menyesuaikan dengan persekitaran pasaran yang berbeza.
-
Mengoptimumkan Syarat Kemasukan, Meningkatkan Kepekaan: Boleh mempertimbangkan untuk mengoptimumkan syarat kemasukan, seperti memperkenalkan lebih banyak penunjuk pengesahan, untuk meningkatkan kepekaan strategi sambil mengekalkan kebolehpercayaan, menangkap lebih banyak peluang perdagangan.
-
Menambah Langkah Menghadapi Keadaan Pasaran Melampau: Untuk keadaan pasaran melampau seperti perubahan pantas dan besar, boleh mempertimbangkan untuk memperkenalkan langkah khas seperti meningkatkan kekuatan henti rugi, atau menghentikan perdagangan sementara, untuk mengurangkan risiko strategi dalam keadaan melampau.
-
Mengoptimumkan Strategi Henti Rugi, Meningkatkan Keupayaan Kawalan Risiko: Boleh mempertimbangkan untuk memperkenalkan lebih banyak syarat henti rugi seperti henti rugi masa, henti rugi lebar, atau memperkenalkan strategi henti rugi dinamik seperti henti rugi menjejak, untuk mengawal risiko dengan lebih baik.
Kesimpulan
Strategi TrendHunter w/MF Multi-Timeframe Trend adalah strategi menjejak arah aliran berdasarkan analisis pelbagai penunjuk dan pelbagai rangka masa. Dengan mengambil kira faktor-faktor seperti Ichimoku Cloud, Moving Average, SuperTrend, WaveTrend, dan Money Flow, syarat kemasukan yang ketat, serta analisis pelbagai rangka masa, strategi ini boleh menangkap arah aliran utama pasaran dengan agak boleh dipercayai, mengelakkan perdagangan kerap dalam pasaran yang tidak menentu, dan mempunyai kestabilan dan kebolehpercayaan yang baik.
Pada masa yang sama, strategi ini juga mempunyai beberapa batasan dan risiko, seperti kekurangan keupayaan pelarasan dinamik, syarat kemasukan mungkin terlalu ketat, kebolehsuaian terhadap keadaan pasaran melampau tidak diketahui, dan strategi henti rugi yang agak mudah. Ini adalah hala tuju yang boleh dioptimumkan dan diperbaiki pada masa hadapan.
Secara keseluruhannya, Strategi TrendHunter w/MF Multi-Timeframe Trend adalah strategi menjejak arah aliran yang berpotensi baik. Apabila menggunakan strategi ini, pedagang harus memahami sepenuhnya prinsip, kelebihan, dan risikonya, serta membuat pelarasan dan pengoptimuman yang diperlukan mengikut toleransi risiko dan gaya perdagangan mereka sendiri. Pada masa yang sama, mereka juga harus memantau perubahan keadaan pasaran dengan teliti dan menyesuaikan strategi tepat pada masanya untuk menyesuaikan dengan perubahan pasaran. Hanya dengan pemahaman mendalam dan penggunaan berhati-hati, strategi ini boleh merealisasikan potensi kelebihannya dan memberikan pulangan yang stabil kepada pedagang.
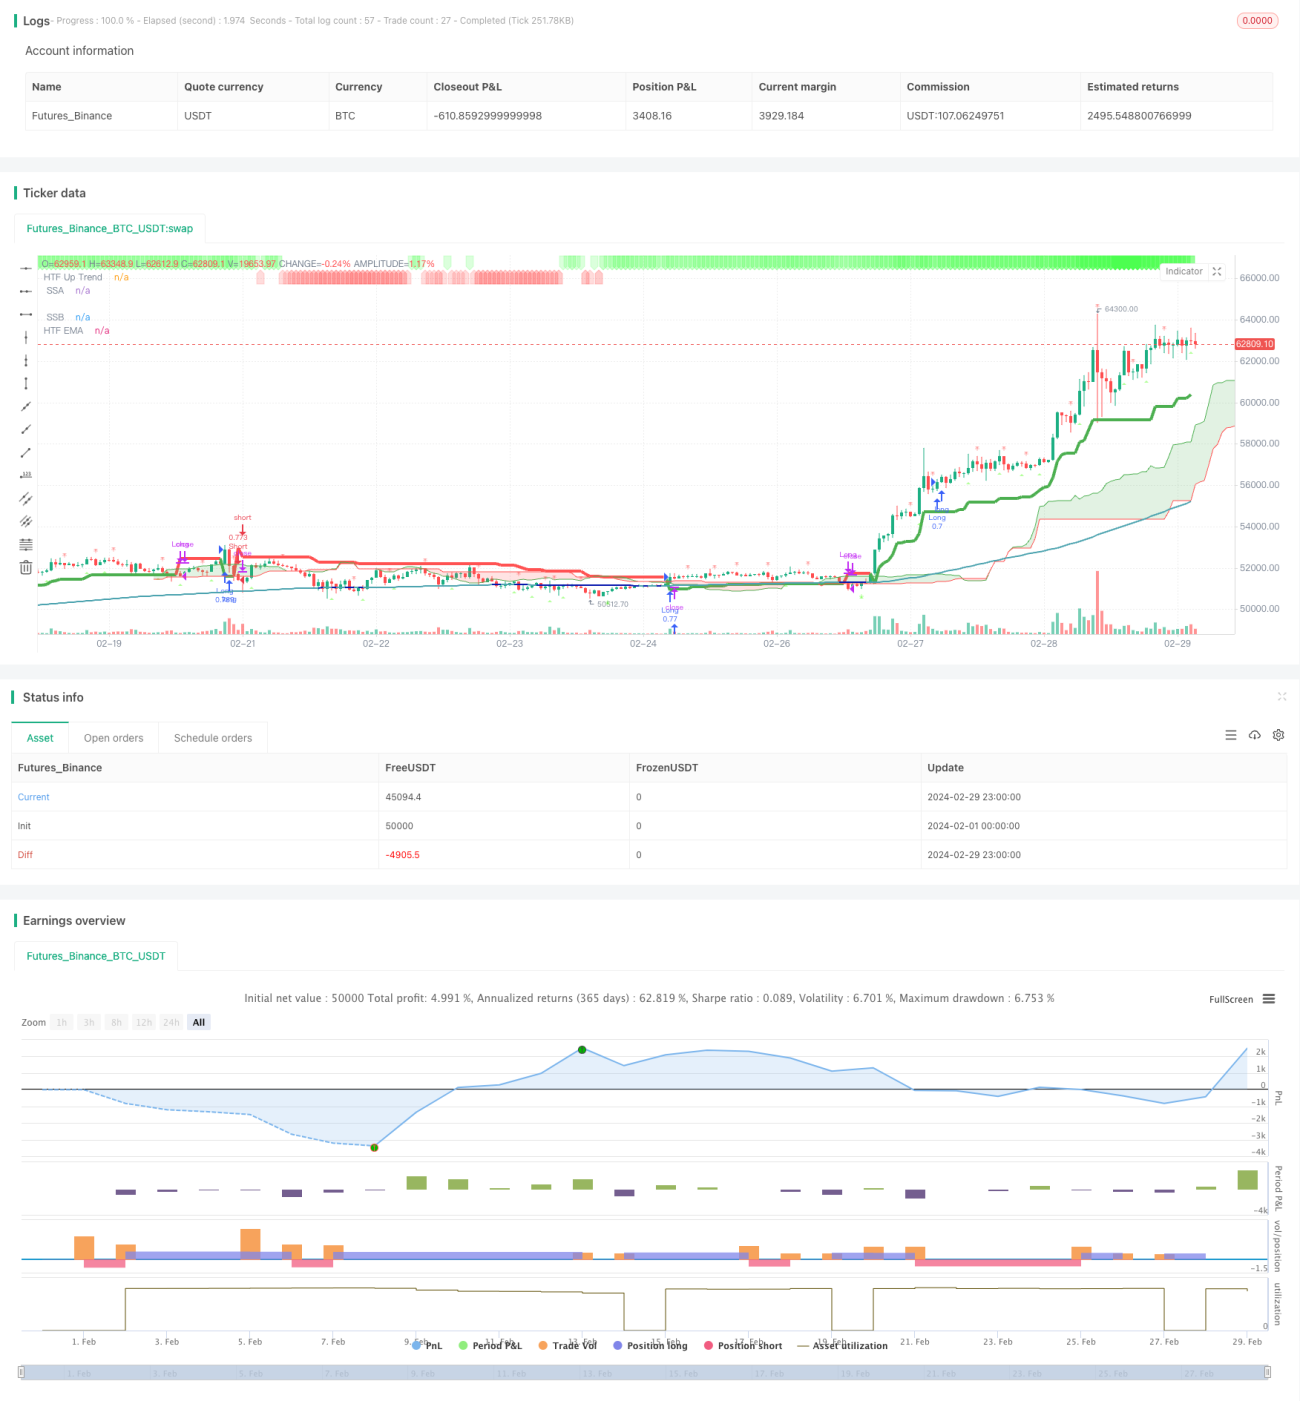
/*backtest
start: 2024-02-01 00:00:00
end: 2024-02-29 23:59:59
period: 1h
basePeriod: 15m
exchanges: [{"eid":"Futures_Binance","currency":"BTC_USDT"}]
*/

// This Pine Script™ code is subject to the terms of the Mozilla Public License 2.0 at https://mozilla.org/MPL/2.0/
// © godzcopilot / blockybears

// Thanks to anthonyf50 for his MTF Ichimoku https://www.tradingview.com/script/Pw9cBFma/- 1