Strategi Mengikuti Trend Indeks Kekuatan Relatif yang Diubahsuai
Tarikh penciptaan:
2024-03-29 16:16:37
Akhirnya diubah suai:
2024-03-29 16:16:37
Salin:
10
Bilangan klik:
728
1
fokus pada
1750
Pengikut
Gambaran keseluruhan
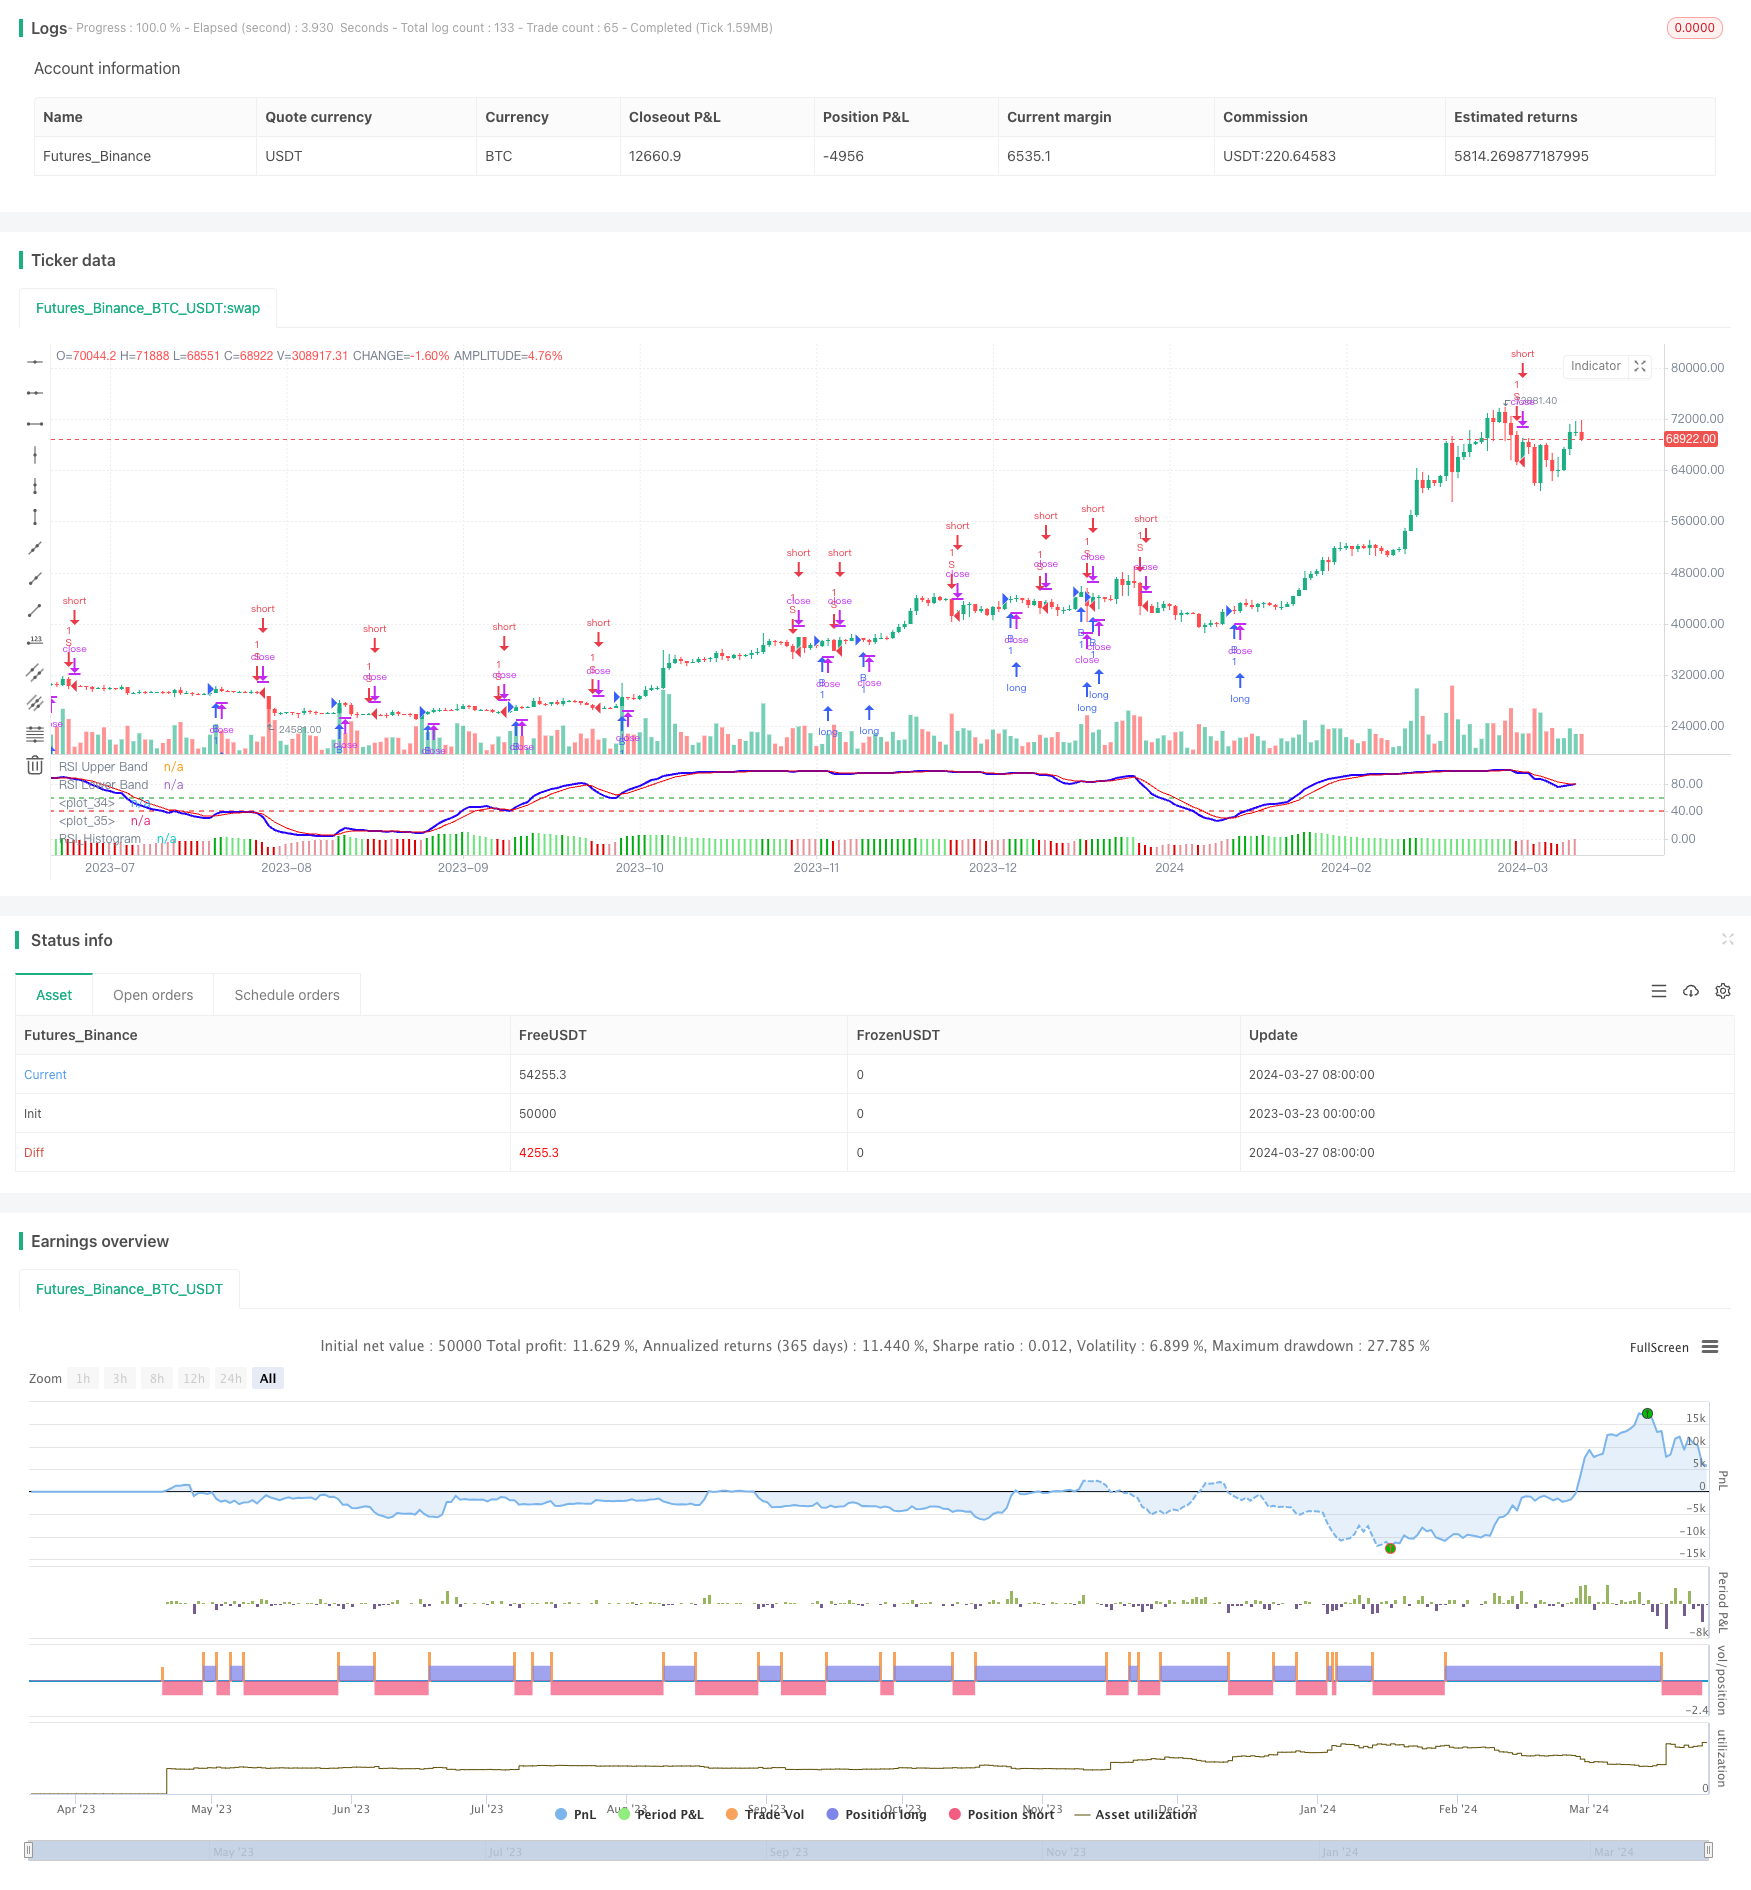
Strategi ini adalah berdasarkan kepada penyesuaian indeks relatif kuat (RSI) untuk menangkap trend pasaran. Idea utama strategi ini adalah menggunakan isyarat silang dan isyarat grafik lurus dari penunjuk RSI yang diubahsuai untuk menilai trend pasaran dan berdagang mengikut arah trend.
Prinsip Strategi
- Mengira harga EMA sebagai input RSI yang diubah suai
- Pengiraan RSI yang diubah suai
- Mengira EMA RSI yang diubahsuai sebagai garis isyarat
- Hitung perbezaan antara RSI yang diubah suai dan garis isyarat sebagai garisan lurus
- Apabila Modified RSI melintasi garis isyarat dan garisan lurus lebih besar daripada 0, menghasilkan isyarat beli
- Sinyal jual dihasilkan apabila Modified RSI melintasi garisan isyarat dan garisan lurusnya kurang daripada 0
Kelebihan Strategik
- Modified RSI lebih baik dalam menangkap trend berbanding RSI tradisional
- Gabungan antara isyarat silang Modified RSI dan isyarat grafik lurus, dapat menyaring isyarat palsu dengan berkesan
- Parameter yang boleh disesuaikan untuk pasaran dan kitaran yang berbeza
- Program ringkas dan cekap
Risiko Strategik
- Modified RSI mudah memberi isyarat yang salah dalam pasaran yang bergolak
- Penangkapan titik perubahan trend mungkin terlewat
- Indeks tunggal mudah diganggu oleh bunyi harga
Arah pengoptimuman strategi
- Boleh digabungkan dengan penunjuk trend lain seperti purata bergerak untuk meningkatkan kebolehpercayaan isyarat
- Modul Stop Loss Stop Stop boleh ditambah untuk mengawal risiko perdagangan tunggal
- Parameter yang boleh dioptimumkan mengikut ciri-ciri pasaran yang berbeza
- Modul pengurusan kedudukan yang boleh disambungkan untuk menyesuaikan kedudukan secara dinamik
ringkaskan
Strategi ini menggunakan ciri-ciri penunjuk RSI yang diubahsuai untuk membina sistem perdagangan dari sudut trend. Penunjuk RSI yang diubahsuai mengatasi beberapa kelemahan penunjuk RSI tradisional, dan keupayaan menangkap trend yang agak kuat. Tetapi strategi penunjuk tunggal sering mempunyai batasan, dan perlu diperbaiki dengan menggunakan teknik lain.
Kod sumber strategi
/*backtest
start: 2023-03-23 00:00:00
end: 2024-03-28 00:00:00
period: 1d
basePeriod: 1h
exchanges: [{"eid":"Futures_Binance","currency":"BTC_USDT"}]
*/

// This source code is subject to the terms of the Mozilla Public License 2.0 at https://mozilla.org/MPL/2.0/
// © YogirajDange

//@version=5


// Verical lines


// // Define the times
// t1 = timestamp(year, month, dayofmonth, 09, 15) // 9:15
// t2 = timestamp(year, month, dayofmonth, 11, 15) // 11:15
// t3 = timestamp(year, month, dayofmonth, 13, 15) // 1:15
// t4 = timestamp(year, month, dayofmonth, 15, 25) // 3:25

// // Check if the current bar is on the current day
// is_today = (year(time) == year(timenow)) and (month(time) == month(timenow)) and (dayofmonth(time) == dayofmonth(timenow))

// // Draw a vertical line at each time
// if is_today and (time == t1 or time == t2 or time == t3 or time == t4)
//     line.new(x1 = bar_index, y1 = low, x2 = bar_index, y2 = high, extend = extend.both, color=color.red, width = 1)

strategy('Modified RSI')
col_grow_above = input(#02ac11, "Above   Grow", group="Histogram", inline="Above")
col_fall_above = input(#6ee47d, "Fall", group="Histogram", inline="Above")
col_grow_below = input(#e5939b, "Below Grow", group="Histogram", inline="Below")
col_fall_below = input(#dd0000, "Fall", group="Histogram", inline="Below")
EMA_length = input.int(13, 'Price_EMA', minval=1)
RSI_length = input.int(14, 'RSI_Period', minval=1)
Avg_length = input.int(5, 'RSI_Avg_EMA', minval=1)
fastMA = ta.ema(close, EMA_length)
modrsi = ta.rsi(fastMA, RSI_length)
RSIAVG = ta.ema(modrsi, Avg_length)
plot(modrsi, color=color.rgb(38, 0, 255), linewidth=2)
plot(RSIAVG, color=color.rgb(247, 0, 0))
rsiUpperBand = hline(60, 'RSI Upper Band', color=#099b0e)
//hline(50, "RSI Middle Band", color=color.new(#787B86, 50))
rsiLowerBand = hline(40, 'RSI Lower Band', color=#e90101)

RSI_hist = modrsi - RSIAVG

//plot(RSI_hist,"RSI_Histogram", color = #c201e9, style = plot.style_columns,linewidth= 5)

plot(RSI_hist, title="RSI_Histogram", style=plot.style_columns, color=(RSI_hist>=0 ? (RSI_hist[1] < RSI_hist ? col_grow_above : col_fall_above) : (RSI_hist[1] < RSI_hist ? col_grow_below : col_fall_below)))


/////// Moving Averages 20 50 EMA

fast_ma = input.int(20, minval=2, title="Fast_EMA")
slow_ma = input.int(50, minval=2, title="Slow_EMA")

src = input.source(close, title="Source")

out = ta.ema(src, fast_ma)
out1 = ta.ema(src, slow_ma)

//plot(out, title="20 EMA", color=color.rgb(117, 71, 247), linewidth = 2)
//plot(out1, title="50 EMA", color=color.rgb(0, 0, 0), linewidth = 2)


longCondition = ((ta.crossover(modrsi, RSIAVG)) and (RSI_hist > 0))
if longCondition
    strategy.entry('B', strategy.long)

shortCondition = ((ta.crossunder(modrsi, RSIAVG)) and (RSI_hist < 0))
if shortCondition
    strategy.entry('S', strategy.short)