Strategi Keuntungan Berbilang Lapisan Perpindahan Purata Perpindahan

Gambaran keseluruhan
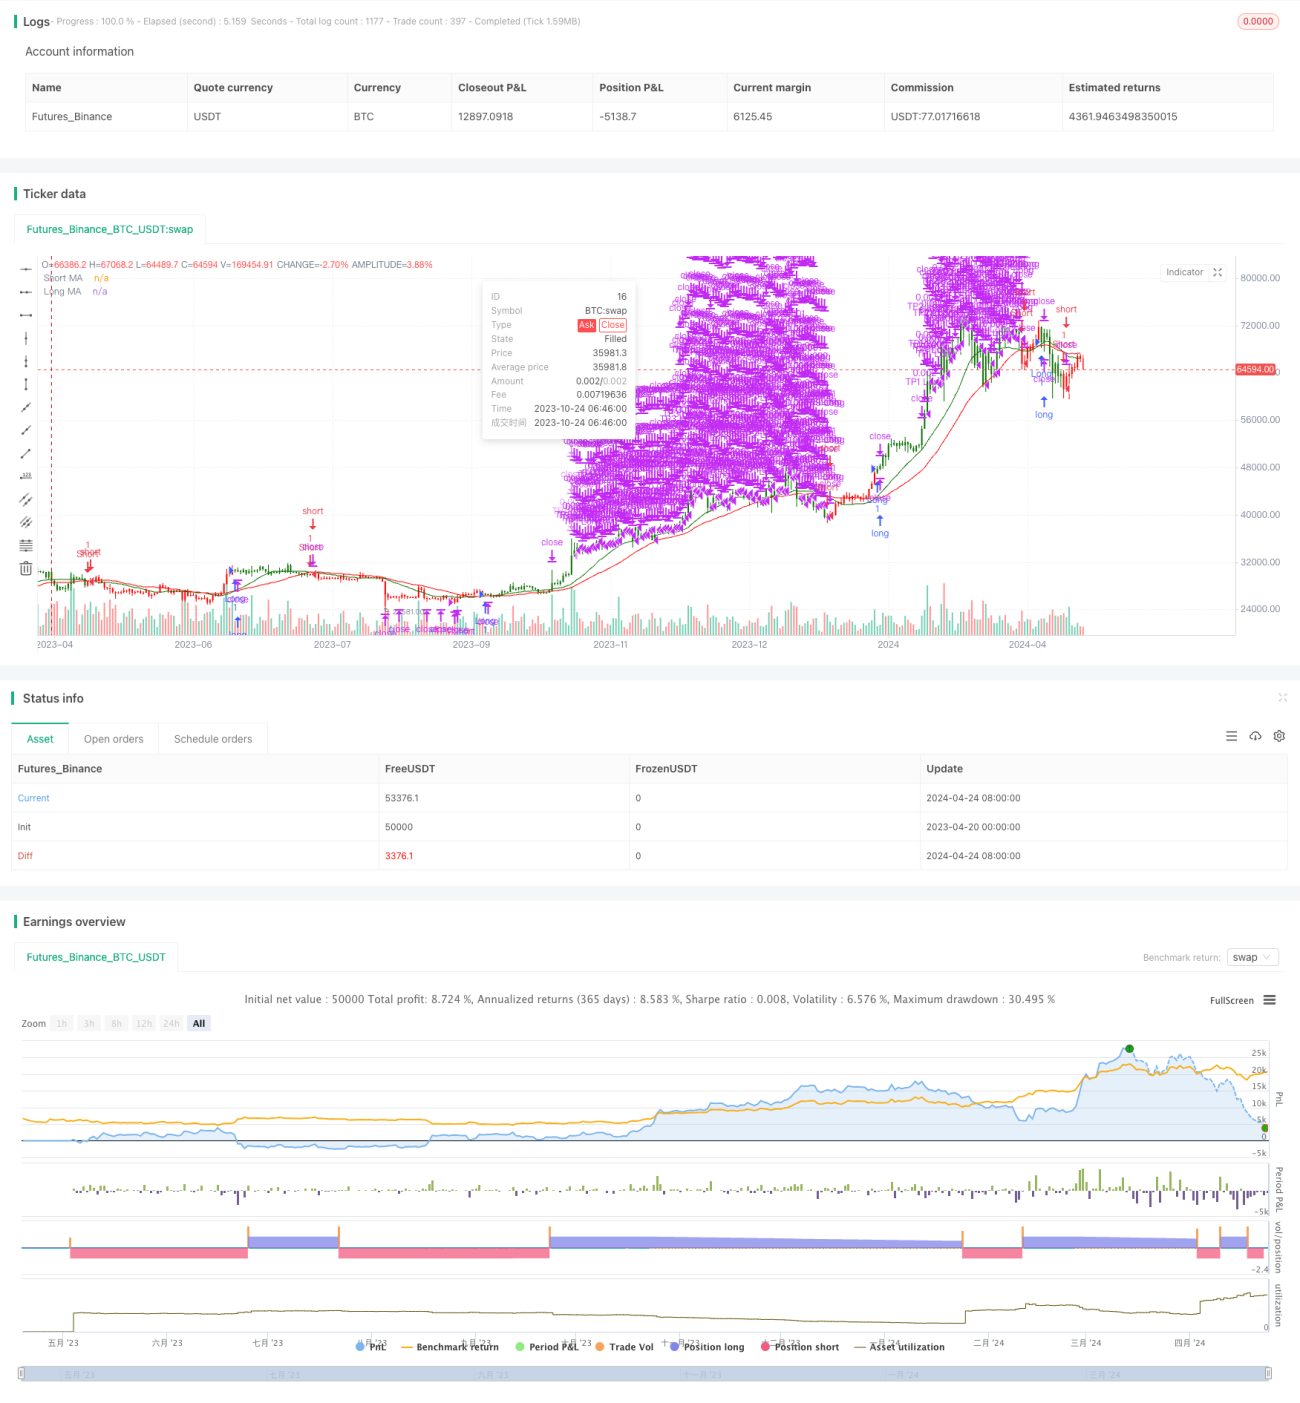
Strategi ini menggunakan persilangan dua rata-rata bergerak untuk menilai trend pasaran, membuka lebih banyak kedudukan ketika bergerak panjang pada rata-rata bergerak jangka pendek, dan sebaliknya membuka posisi kosong. Pada masa yang sama, strategi ini menggunakan pelbagai tahap keuntungan dan berakhir dengan cara, apabila harga mencapai tahap keuntungan yang disengajakan, dan kemudian menutup posisi secara berturut-turut, untuk memaksimumkan keuntungan dan mengawal risiko.
Prinsip Strategi
Strategi ini menggunakan purata bergerak untuk menangkap trend pasaran. Apabila bergerak jangka pendek di atas rata-rata bergerak jangka panjang, bermakna pasaran mungkin memasuki trend naik, dan membuka lebih banyak kedudukan; apabila bergerak jangka pendek di bawah rata-rata bergerak jangka panjang, bermakna pasaran mungkin memasuki trend menurun, dan membuka posisi kosong.
Kelebihan Strategik
- Sederhana dan berkesan: Strategi ini adalah berdasarkan kepada prinsip klasik moving average crossover, mudah difahami, dan terbukti berkesan dalam praktiknya.
- Pelbagai tahap keuntungan: Dengan menetapkan pelbagai tahap keuntungan, dan menetapkan kedudukan kosong secara berturut-turut apabila harga mencapai tahap ini, keuntungan dapat dimaksimumkan, dan risiko dapat dikendalikan.
- Fleksibiliti parameter: Tetapan parameter strategi ini sangat fleksibel, pengguna boleh menyesuaikan kitaran purata bergerak dan tahap keuntungan mengikut keperluan mereka dan ciri-ciri pasaran untuk mencapai kesan terbaik.
Risiko Strategik
- Risiko turun naik pasaran: Apabila pasaran mengalami turun naik yang kuat, isyarat silang yang kerap boleh menyebabkan strategi sering berdagang, meningkatkan kos perdagangan dan risiko penarikan balik.
- Risiko penetapan parameter: penetapan parameter yang tidak tepat boleh menyebabkan prestasi strategi yang tidak baik, seperti pilihan kitaran purata bergerak yang tidak betul, atau penetapan tahap keuntungan yang tidak munasabah.
- Risiko pengiktirafan trend: Strategi ini bergantung kepada trend, dan lebih banyak isyarat palsu mungkin berlaku apabila pasaran bergolak atau trend tidak jelas, menyebabkan kerugian.
Arah pengoptimuman strategi
- Gabungan dengan petunjuk lain: Gabungan dengan petunjuk teknikal lain seperti RSI, MACD dan lain-lain boleh dipertimbangkan untuk meningkatkan ketepatan dan kebolehpercayaan pengenalan trend.
- Parameter pengoptimuman: Dengan pengesanan dan pengoptimuman, anda boleh mencari kitaran purata bergerak dan parameter tahap keuntungan yang terbaik untuk menyesuaikan diri dengan keadaan pasaran yang berbeza.
- Menambah Hentikan: Anda boleh mempertimbangkan untuk memasukkan mekanisme Hentikan untuk mengawal risiko lebih lanjut, seperti Hentikan Dinamik berdasarkan tetapan ATR dan sebagainya.
- Ubah masuk dan keluar: lebih banyak syarat masuk dan keluar boleh dijelajahi, seperti mempertimbangkan faktor seperti jumlah dagangan, rintangan sokongan, dan sebagainya, untuk meningkatkan kestabilan strategi.
ringkaskan
Strategi keuntungan bertingkat bergerak adalah strategi penjejakan trend yang mudah dan berkesan, dengan cara yang menghasilkan keuntungan bertingkat, anda boleh mendapatkan lebih banyak keuntungan dalam trend sambil mengawal risiko. Walau bagaimanapun, strategi ini juga mempunyai beberapa batasan dan risiko, yang perlu dioptimumkan dan diperbaiki mengikut keadaan pasaran dan keperluan pengguna tertentu.
/*backtest
start: 2023-04-20 00:00:00
end: 2024-04-25 00:00:00
period: 1d
basePeriod: 1h
exchanges: [{"eid":"Futures_Binance","currency":"BTC_USDT"}]
*/

// This Pine Script™ code is subject to the terms of the Mozilla Public License 2.0 at https://mozilla.org/MPL/2.0/
// © ValdesTradingBots

//Follow Us for More Insights and Updates!- 1