RSI dan Strategi Kuantitatif Isyarat Crossover EMA Berganda

Gambaran keseluruhan
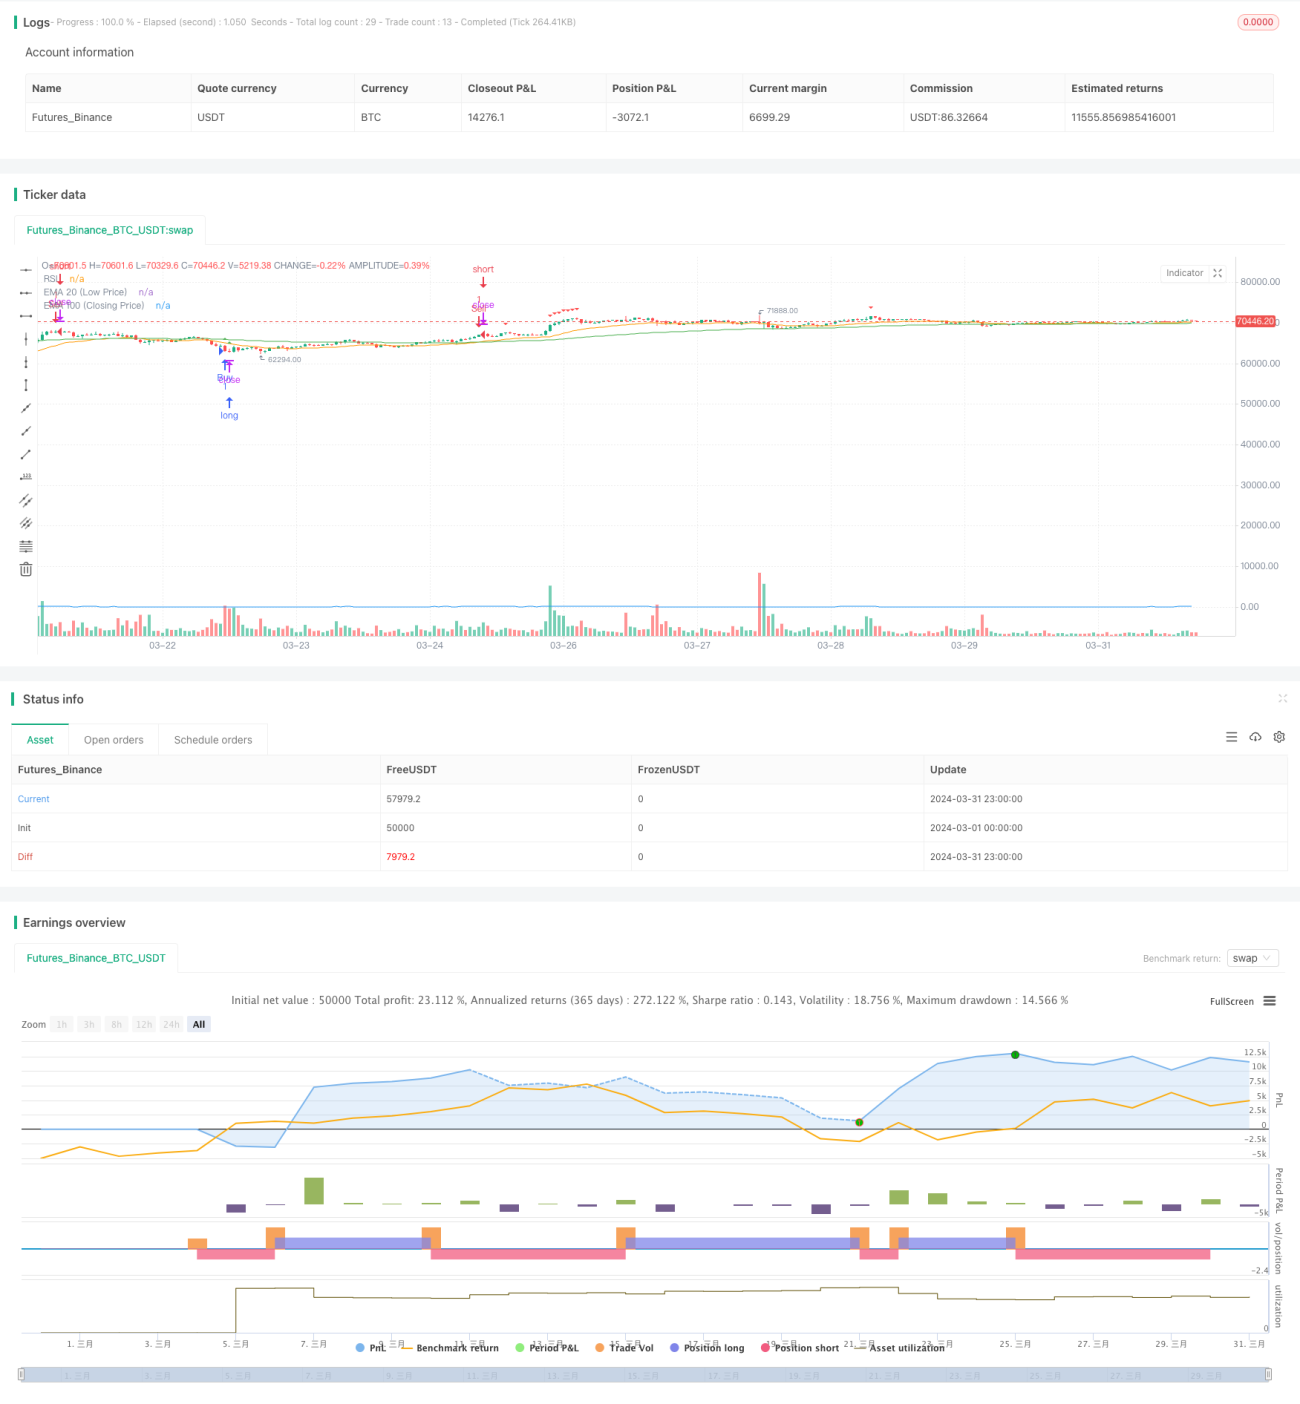
Strategi ini berdasarkan kepada RSI dan dua garis EMA untuk menentukan titik jual beli. Ia menghasilkan isyarat beli apabila harga tutup jatuh di bawah EMA100 dan EMA20 dan nilai RSI di bawah 30. Ia menghasilkan isyarat jual apabila harga tutup menembusi EMA100 dan EMA20 dan nilai RSI di atas 70.
Prinsip Strategi
- Mengira nilai RSI untuk menilai keadaan pasaran overbought dan oversold. Apabila RSI di bawah 30 dianggap sebagai kawasan oversold dan di atas 70 dianggap sebagai kawasan oversold.
- Dua garis purata EMA100 untuk harga penutupan dan EMA20 untuk harga terendah dikira sebagai asas untuk menilai trend.
- Apabila harga penutupan jatuh di bawah EMA100 dan EMA20, dan nilai RSI di bawah 30, ia dianggap sebagai oversold dan cenderung ke bawah, menghasilkan isyarat beli.
- Apabila harga penutupan menembusi EMA100 dan EMA20, dan nilai RSI lebih tinggi daripada 70, ia dinilai sebagai overbought dan cenderung ke atas, menghasilkan isyarat jual.
- Beli apabila isyarat dicetuskan dan buka lebih banyak, jual apabila isyarat dicetuskan dan tutup.
Analisis kelebihan
- Gabungan RSI dengan EMA akan membantu anda menentukan masa trend bertukar dan berbelanja lebih banyak dan mengurangkan isyarat yang salah.
- Parameter boleh disesuaikan, boleh dioptimumkan mengikut standard dan kitaran yang berbeza, mempunyai kebolehsuaian dan fleksibiliti tertentu.
- Logiknya ringkas dan jelas, mudah difahami dan dilaksanakan, tanpa memerlukan banyak asas analisis teknikal.
- Ia sesuai untuk kegunaan semasa berlakunya kejatuhan pasaran, dapat menangkap ketinggian dan ketinggian pergerakan, dan mengambil keuntungan dari perbezaan harga.
Analisis risiko
- Untuk trend unilateral, ia mungkin tidak berkesan, dan apabila trend terbentuk, ia akan menghasilkan isyarat salah secara berturut-turut.
- Parameter tetap, kekurangan keupayaan untuk menyesuaikan diri dengan pasaran yang dinamik, mudah dipengaruhi oleh perubahan irama pasaran.
- Perdagangan yang kerap dalam keadaan yang bergolak boleh menyebabkan slippage yang lebih besar dan caj, yang menjejaskan keuntungan strategi.
- Kurangnya pengurusan kedudukan dan kawalan risiko, penarikan balik dan kerugian maksimum tidak terkawal.
Arah pengoptimuman
- Menambahkan kriteria penilaian trend, seperti penembusan MA, DMI dan lain-lain, untuk mengelakkan masuk awal dalam trend unilateral.
- Mengoptimumkan parameter RSI dan EMA untuk mencari kombinasi parameter yang paling sesuai dan berkala untuk meningkatkan ketepatan isyarat.
- Memperkenalkan model pengurusan kedudukan, seperti kedudukan ATR atau formula Kelly, untuk mengawal perkadaran dana setiap perdagangan, mengurangkan risiko.
- Tetapkan syarat-syarat hentian dan hentian, seperti peratusan hentian tetap atau hentian bergerak, untuk mengawal kerugian maksimum dan pulangan keuntungan dalam satu perdagangan.
- Gabungan dengan penunjuk lain seperti MACD, Brinband, dan lain-lain, meningkatkan pengesahan isyarat dan mengurangkan kesalahan.
ringkaskan
Strategi kuantifikasi RSI dengan tanda silang EMA ganda adalah strategi perdagangan kuantifikasi yang mudah dan praktikal, dengan menggabungkan indikator RSI dengan garis rata EMA, dapat menangkap tinggi dan rendah dalam keadaan gegaran, untuk melakukan arbitraj perbezaan harga. Tetapi strategi ini juga mempunyai beberapa batasan dan risiko, seperti kegagalan dalam keadaan trend, kekurangan pengurusan kedudukan dan langkah-langkah kawalan risiko, dan lain-lain. Oleh itu, dalam aplikasi sebenar, pengoptimuman dan penambahbaikan yang sesuai diperlukan berdasarkan ciri-ciri pasaran dan keutamaan individu untuk meningkatkan kestabilan dan keuntungan strategi.
- 1