Strategi beli dan jual berdasarkan peta haba volum dan harga masa nyata

Gambaran keseluruhan
Strategi ini menggabungkan grafik panas jumlah transaksi dan harga masa nyata untuk menghasilkan isyarat jual beli dengan menganalisis harga dan pengedaran jumlah transaksi dalam jangka masa tertentu. Strategi ini pertama-tama mengira beberapa tahap harga berdasarkan peratusan harga semasa dan julat harga yang ditetapkan. Kemudian mengkaji jumlah transaksi pembelian dan penjualan setiap tahap harga dalam jangka masa yang lalu dan mengira jumlah transaksi pembelian dan penjualan yang terkumpul.
Prinsip Strategi
- Beberapa tahap harga dikira berdasarkan peratusan harga semasa dan harga yang ditetapkan.
- Mengira jumlah dagangan yang dibeli dan dijual pada setiap tahap harga dalam tempoh masa yang lalu dan mengira jumlah dagangan yang dibeli dan dijual secara berturut-turut.
- Tentukan warna label dan paparkan label atau lukis grafik berdasarkan jumlah dagangan dan pembelian yang telah dikumpul.
- Menggambar kurva harga dalam masa nyata.
- Mengira EMA, VWAP dan sebagainya.
- Berdasarkan hubungan harga dengan indikator seperti EMA, VWAP dan syarat kuantiti urus niaga, dinilai sama ada syarat pembelian dipenuhi. Jika ia dipenuhi dan tidak menghasilkan isyarat sebelumnya, isyarat pembelian dihasilkan.
- Berdasarkan hubungan harga dengan indikator seperti EMA dan syarat kuantiti transaksi, menilai sama ada syarat jual memenuhi syarat. Jika dipenuhi dan tidak menghasilkan isyarat sebelumnya, maka menghasilkan isyarat jual. Jika terdapat dua saluran negatif berturut-turut dan tidak menghasilkan isyarat sebelumnya, maka menghasilkan isyarat jual.
- Rekodkan keadaan keadaan jual beli semasa dan mengemas kini keadaan penciptaan isyarat.
Analisis kelebihan
- Gabungan dengan carta panas dan harga masa nyata, ia dapat menunjukkan secara visual peredaran harga dan jumlah transaksi, memberikan rujukan untuk keputusan perdagangan.
- Memperkenalkan EMA, VWAP dan lain-lain, memperkaya penilaian syarat strategi dan meningkatkan kebolehpercayaan strategi.
- Ia juga mengambil kira pelbagai faktor seperti harga, indikator dan jumlah transaksi, yang menjadikan isyarat jual beli lebih komprehensif dan kukuh.
- Ia menetapkan syarat-syarat yang mengehadkan pengeluaran isyarat, mengelakkan keadaan yang menghasilkan isyarat berulang secara berturut-turut, dan mengurangkan isyarat yang mengelirukan.
Analisis risiko
- Prestasi strategi mungkin dipengaruhi oleh tetapan parameter seperti peratusan julat harga, tempoh pengembalian, dan lain-lain yang perlu disesuaikan dan dioptimumkan mengikut keadaan tertentu.
- EMA, VWAP dan lain-lain juga mempunyai kemunduran dan keterbatasan dan mungkin tidak berkesan dalam keadaan pasaran tertentu.
- Strategi ini digunakan terutamanya untuk pasaran yang lebih trendy, yang mungkin menghasilkan lebih banyak isyarat palsu di pasaran goyah.
- Langkah-langkah kawalan risiko strategi agak mudah, kekurangan kaedah pengurusan risiko seperti menghentikan kerugian dan pengurusan kedudukan.
Arah pengoptimuman
- Memperkenalkan lebih banyak petunjuk teknikal dan sentimen pasaran, seperti RSI, MACD, dan Bollinger Bands, untuk memperkaya dasar penilaian strategi.
- Mengoptimumkan keadaan untuk menghasilkan isyarat beli dan jual, meningkatkan ketepatan dan kebolehpercayaan isyarat. Anda boleh mempertimbangkan untuk memperkenalkan analisis beberapa bingkai masa untuk mengesahkan arah trend.
- Menambah langkah-langkah kawalan risiko seperti pengurusan hentian dan kedudukan, menetapkan hentian dan saiz kedudukan yang munasabah, mengawal had risiko untuk perdagangan tunggal.
- Optimasi parameter dan pengujian semula strategi untuk mencari kombinasi parameter yang optimum dan ruang lingkup penggunaan pasaran.
- Pertimbangkan untuk menggabungkan strategi ini dengan strategi lain untuk memanfaatkan kelebihan strategi yang berbeza dan meningkatkan kestabilan dan keuntungan secara keseluruhan.
ringkaskan
Strategi ini menghasilkan isyarat jual beli dengan menggabungkan carta panas volumes, harga masa nyata dan beberapa petunjuk teknikal, dan mempunyai nilai rujukan tertentu. Kelebihan strategi ini adalah dapat menunjukkan secara visual harga dan pengedaran volumes, dan mempertimbangkan pelbagai faktor untuk menghasilkan isyarat. Tetapi strategi ini juga mempunyai beberapa batasan dan risiko, seperti kesan parameter, keterbelakangan indikator, bergantung pada pasaran yang sedang tren, dan sebagainya. Oleh itu, dalam aplikasi sebenar, strategi perlu dioptimumkan dan disempurnakan, seperti memperkenalkan lebih banyak petunjuk, mengoptimumkan keadaan isyarat, meningkatkan kawalan risiko, dan sebagainya, untuk meningkatkan kestabilan dan keuntungan strategi.
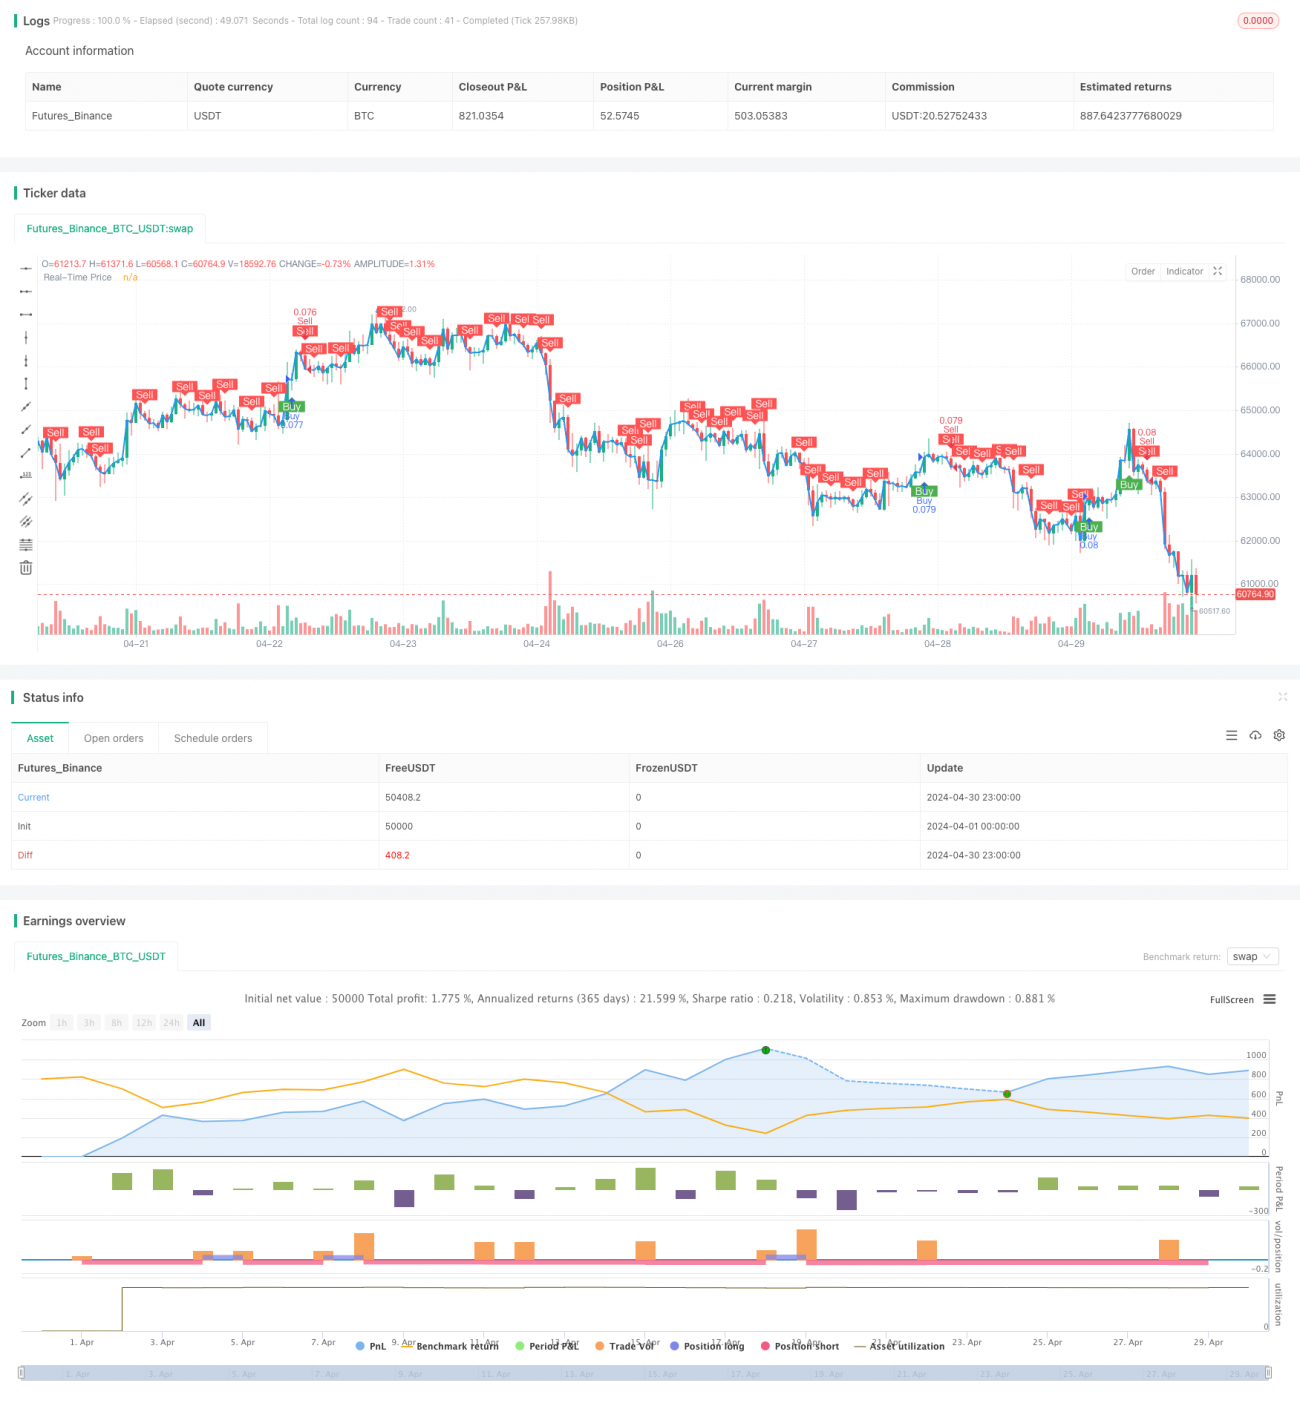
/*backtest
start: 2024-04-01 00:00:00
end: 2024-04-30 23:59:59
period: 1h
basePeriod: 15m
exchanges: [{"eid":"Futures_Binance","currency":"BTC_USDT"}]
*/

//@version=5
strategy("Buy and Sell Volume Heatmap with Real-Time Price Strategy", overlay=true, default_qty_type=strategy.percent_of_equity, default_qty_value=10)

// Settings for Volume Heatmap- 1