Strategi Beli dan Jual VWAP dan Super Trend

Gambaran keseluruhan
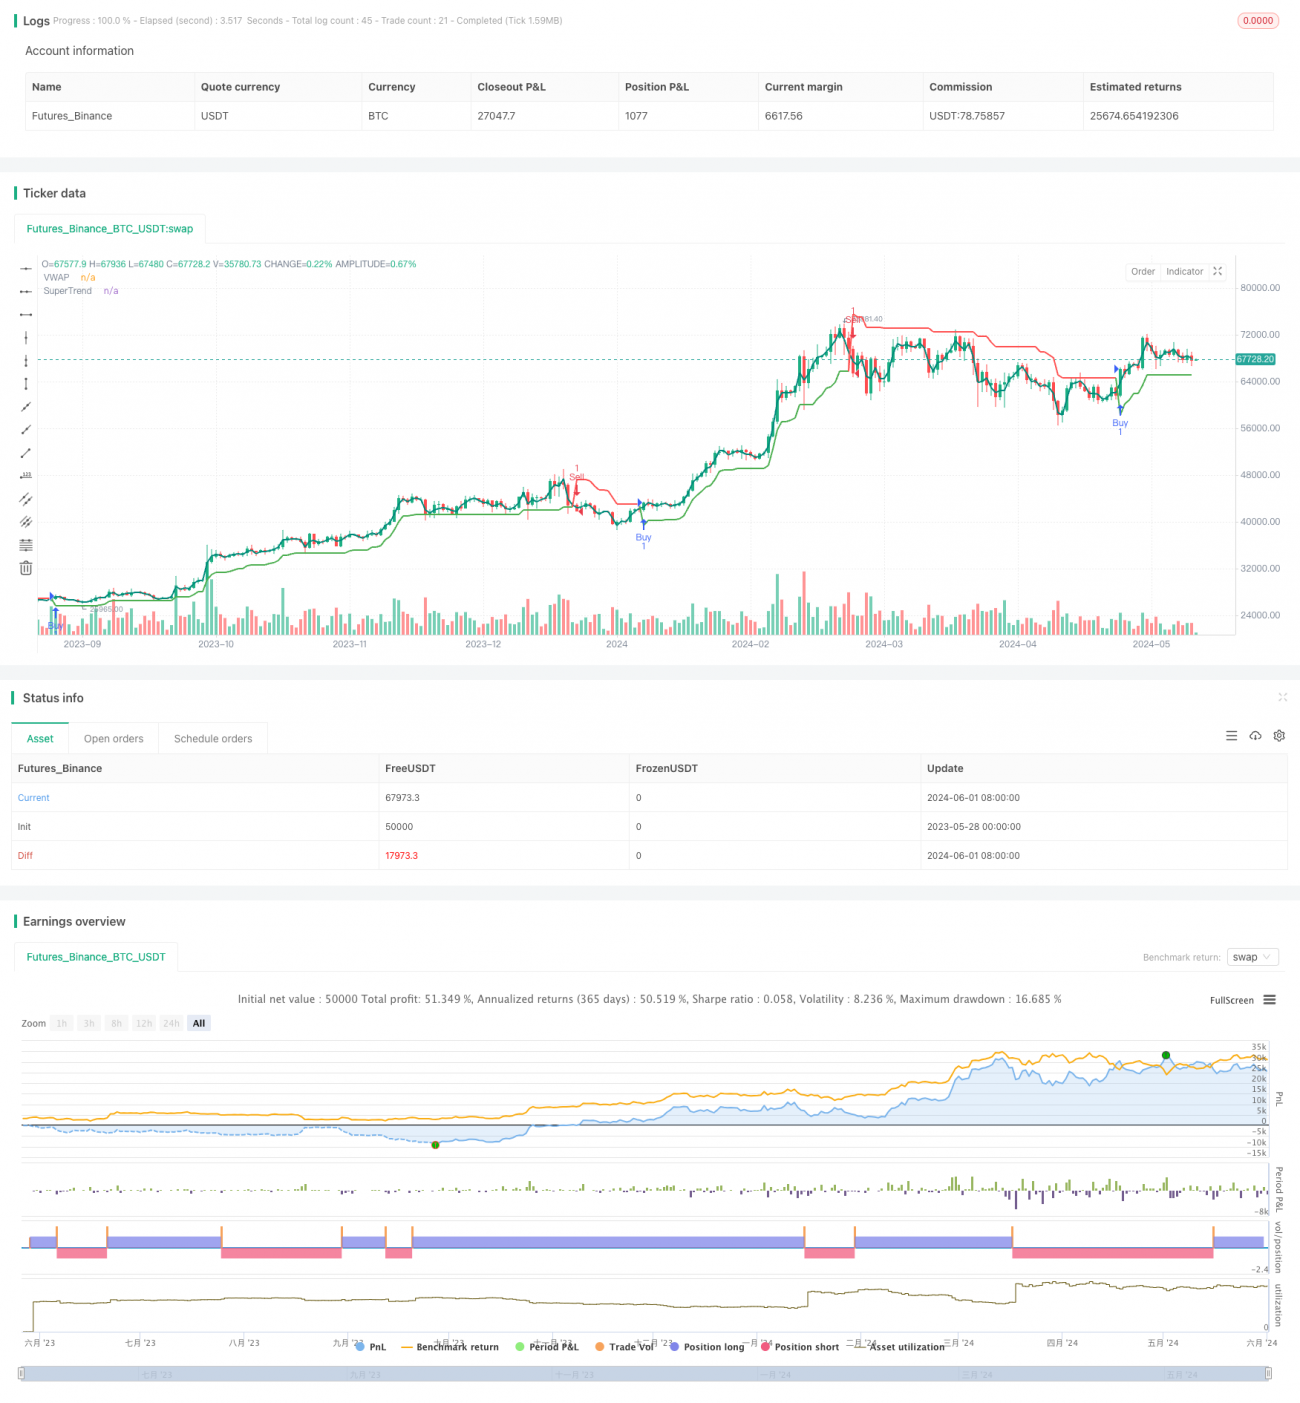
Strategi ini menggabungkan VWAP (harga purata bertimbangan kuantiti) dan indikator supertrend. Untuk menilai isyarat beli dan jual, ia membandingkan kedudukan harga dengan VWAP dan arah indikator supertrend. Isyarat beli dihasilkan apabila harga melintasi VWAP dan trend super positif; isyarat jual dihasilkan apabila harga melintasi VWAP dan trend super negatif.
Prinsip Strategi
- Untuk mengira indikator VWAP, gunakan fungsi ta.vwap, anda boleh menyesuaikan panjang VWAP.
- Untuk mengira indikator supertrend, gunakan fungsi ta.supertrend, anda boleh menyesuaikan kitaran dan pengganda ATR.
- Syarat pembelian: VWAP dikenakan pada harga semasa, dan arah trend super adalah positif.
- Keadaan Jualan: VWAP di bawah harga semasa, dan arah trend super negatif.
- Mencatatkan keadaan isyarat terakhir, untuk mengelakkan isyarat arah yang berturut-turut. Isyarat baru hanya akan dihasilkan jika isyarat semasa berbeza dengan isyarat sebelumnya.
Kelebihan Strategik
- Gabungan kedua-dua penunjuk VWAP dan Supertrend membolehkan penilaian lebih menyeluruh mengenai trend pasaran dan potensi titik perubahan.
- Indeks VWAP mengambil kira faktor kuantiti urus niaga untuk mencerminkan lebih baik trend sebenar pasaran.
- Indikator Supertrend mempunyai ciri-ciri untuk mengesan trend dan menyaring getaran, yang membantu menangkap trend utama.
- Dengan mengelakkan mekanisme untuk mengulangi isyarat, anda boleh mengurangkan frekuensi transaksi dan mengurangkan kos transaksi.
Risiko Strategik
- Strategi ini mungkin menghasilkan lebih banyak isyarat palsu apabila pasaran bergolak atau trend tidak jelas.
- Prestasi strategi bergantung kepada pilihan parameter VWAP dan Supertrend, dan tetapan parameter yang berbeza boleh menyebabkan hasil yang berbeza.
- Strategi ini tidak mengambil kira pengurusan risiko dan kawalan kedudukan, dan ia perlu digunakan dalam kombinasi dengan langkah-langkah lain untuk mengawal risiko.
Arah pengoptimuman strategi
- Menambah mekanisme pengesahan trend, seperti menggunakan garis rata-rata atau penunjuk trend lain, untuk menapis isyarat lebih lanjut.
- Pilihan parameter yang dioptimumkan untuk mencari panjang VWAP, kitaran ATR dan kombinasi penggandaan yang optimum dengan mengkaji semula data sejarah.
- Memperkenalkan langkah-langkah pengurusan risiko, seperti menetapkan hentian dan hentian, untuk mengawal risiko perdagangan tunggal.
- Pertimbangkan untuk menggunakan strategi pengurusan wang, seperti peratusan tetap atau formula Kelly, untuk mengoptimumkan saiz kedudukan.
ringkaskan
Strategi VWAP dan Super Trend Buy and Sell berusaha untuk menangkap trend pasaran dan titik perubahan yang berpotensi dengan menggabungkan dua jenis indikator. Logik strategi jelas, mudah dilaksanakan dan dioptimumkan. Namun, prestasi strategi ini bergantung pada pilihan parameter dan kekurangan langkah-langkah pengurusan risiko. Dalam aplikasi sebenar, lebih banyak pengoptimuman dan penyempurnaan diperlukan untuk menyesuaikan diri dengan keadaan pasaran dan keperluan perdagangan yang berbeza.
- 1