Strategi dagangan VWAP dan pemantauan anomali volum

VWAP RSI YTD SMA
Tarikh penciptaan: 2024-06-07 15:44:04 Akhirnya diubah suai: 2024-06-07 15:44:04
Salin: 0 Bilangan klik: 717
1
fokus pada
1617
Pengikut

Strategi dagangan VWAP dan pemantauan anomali volum

Gambaran keseluruhan

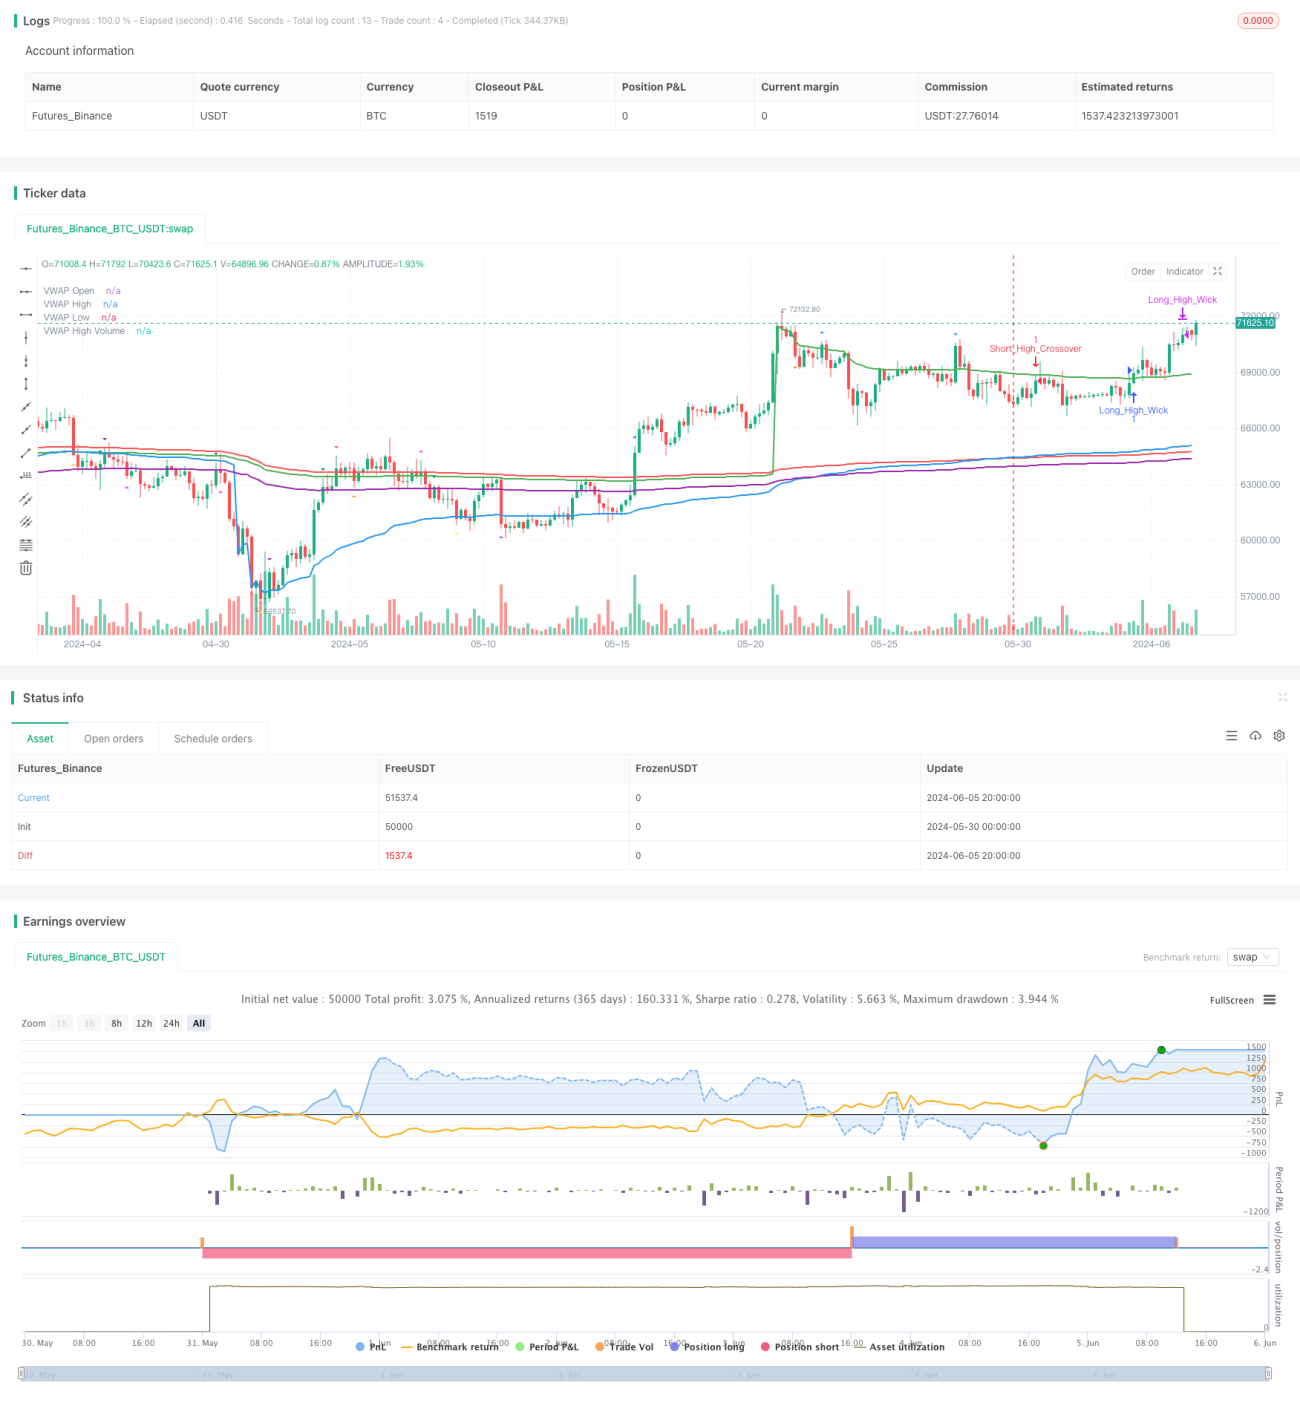
Strategi ini adalah berdasarkan kepada beberapa VWAP (rata-rata harga bertimbangan dengan jumlah transaksi) yang merangkumi harga pembukaan, harga tertinggi, harga terendah, dan grafik yang mempunyai jumlah transaksi yang luar biasa. Strategi ini menggunakan VWAP sebagai tahap sokongan dan tahap rintangan, sambil mempertimbangkan keadaan luar biasa dalam jumlah transaksi.

Prinsip Strategi

  1. Hitung pelbagai tahap VWAP, termasuk VWAP harga pembukaan, VWAP harga tertinggi, VWAP harga terendah, dan VWAP dengan carta jumlah urus niaga yang luar biasa.
  2. Mengesan peta lalu lintas yang luar biasa dan meletakkan semula pembolehubah VWAP yang luar biasa pada peta tersebut.
  3. Tetapkan nilai penyimpangan di atas dan di bawah tahap VWAP sebagai syarat pemicu isyarat perdagangan.
  4. Semak untuk melihat sama ada harga berada di sisi lain VWAP untuk mengelakkan isyarat yang salah.
  5. Bergantung pada kedudukan harga terhadap VWAP dan hubungan antara harga penutupan dan harga pembukaan, beberapa jenis isyarat perdagangan dihasilkan, termasuk Wick ((garis bayangan) dan Crossover ((bersalib)).
  6. Menggunakan indikator RSI untuk mengesan perubahan kuantiti pergerakan, apabila RSI lebih daripada 70 atau kurang daripada 30, perdagangan yang seimbang.

Analisis kelebihan

  1. Strategi ini menggunakan pelbagai tahap VWAP untuk memberikan maklumat yang lebih menyeluruh mengenai sokongan dan rintangan.
  2. Strategi ini dapat menangkap perubahan penting dalam pasaran dengan mengesan peta yang mempunyai jumlah lalu lintas yang luar biasa.
  3. Menetapkan nilai penyimpangan boleh menyaring beberapa isyarat bising dan meningkatkan kualiti isyarat perdagangan.
  4. Berikutan kenaikan harga di sisi lain VWAP, beberapa isyarat yang salah telah dielakkan.
  5. Bergantung pada kedudukan harga berbanding VWAP dan hubungan antara harga penutupan dan harga pembukaan, menghasilkan beberapa isyarat perdagangan, meningkatkan fleksibiliti strategi.
  6. Menggunakan indikator RSI sebagai syarat kedudukan rata dapat membantu strategi untuk keluar dari perdagangan tepat pada masanya apabila terdapat perubahan momentum.

Analisis risiko

  1. Strategi ini bergantung kepada tahap VWAP, yang mungkin tidak berkesan jika berlaku keadaan yang melampau di pasaran.
  2. Keputusan mengenai jumlah transaksi yang luar biasa adalah berdasarkan nilai terhad yang tetap dan mungkin tidak dapat disesuaikan dengan keadaan pasaran yang berbeza.
  3. Tetapan nilai penyimpangan mungkin perlu diselaraskan mengikut pasaran dan jenis perdagangan yang berbeza.
  4. Strategi ini menghasilkan banyak isyarat perdagangan yang boleh menyebabkan perdagangan berlebihan dan kos dagangan yang tinggi.
  5. Indeks RSI mungkin menghasilkan isyarat kedudukan rendah yang terlewat, menyebabkan strategi menanggung risiko yang lebih besar.

Arah pengoptimuman

  1. Mengoptimumkan kaedah pengiraan tahap VWAP, seperti mempertimbangkan tempoh masa yang lebih lama atau menggunakan kaedah berat.
  2. Mengoptimumkan kriteria untuk menilai jumlah transaksi yang luar biasa, seperti penggunaan had penyesuaian atau gabungan dengan penunjuk jumlah transaksi lain.
  3. Pengoptimuman parameter untuk nilai penyimpangan untuk mencari amplitudo penyimpangan terbaik.
  4. Memperkenalkan langkah-langkah pengurusan risiko, seperti menetapkan hentian dan halangan dan mengawal had risiko untuk perdagangan tunggal.
  5. Cuba lain-lain petunjuk momentum atau gabungan beberapa petunjuk untuk mendapatkan isyarat kedudukan yang lebih tepat.
  6. Menapis isyarat perdagangan untuk mengurangkan perdagangan berlebihan dan mengurangkan kos perdagangan.

ringkaskan

Strategi ini menggunakan pelbagai tahap VWAP dan pengesanan yang luar biasa untuk menghasilkan pelbagai isyarat perdagangan. Dengan mengambil kira kedudukan harga dan perbandingan VWAP, hubungan harga penutupan dengan harga pembukaan, dan RSI, strategi ini cuba menangkap perubahan penting di pasaran dan keluar dari perdagangan tepat pada masanya. Walau bagaimanapun, strategi ini juga mempunyai beberapa risiko, seperti kesesuaian dengan keadaan yang melampau, perdagangan berlebihan dan isyarat kedudukan terlewat.

Kod sumber strategi
/*backtest
start: 2024-05-30 00:00:00
end: 2024-06-06 00:00:00
period: 4h
basePeriod: 15m
exchanges: [{"eid":"Futures_Binance","currency":"BTC_USDT"}]
*/

//@version=5
strategy("5 Anchored VWAP Strategy with Abnormally High Volume Candle", overlay=true)

// Initialize VWAP variables
var float vwap_open = na
var float vwap_high = na
var float vwap_low = na
var float vwap_high_volume = na

var float cum_v_open = 0
var float cum_v_high = 0
var float cum_v_low = 0
var float cum_v_high_volume = 0

var float cum_pv_open = 0
var float cum_pv_high = 0
var float cum_pv_low = 0
var float cum_pv_high_volume = 0

var float highest_volume = 0

// Initialize YTD high and low variables
var float ytd_high = na
var float ytd_low = na

// Parameters for abnormal volume detection
length = 20
volume_threshold = 2.0

// Displacement parameters
displacement_percentage = 0.01 // 1% displacement

// Calculate average volume
avg_volume = ta.sma(volume, length)

// Check if it's the first day of the year
is_first_day_of_year = year(time) != year(time[1])

// Reset YTD high and low on the first day of the year
if is_first_day_of_year
    ytd_high := high
    ytd_low := low

// Update YTD high and low
ytd_high := na(ytd_high) ? high : math.max(ytd_high, high)
ytd_low := na(ytd_low) ? low : math.min(ytd_low, low)

// Update cumulative variables for open VWAP
cum_v_open += volume
cum_pv_open += close * volume
if cum_v_open != 0
    vwap_open := cum_pv_open / cum_v_open

// Update cumulative variables for high VWAP
if high == ytd_high
    cum_v_high := 0
    cum_pv_high := 0

cum_v_high += volume
cum_pv_high += close * volume
if cum_v_high != 0
    vwap_high := cum_pv_high / cum_v_high

// Update cumulative variables for low VWAP
if low == ytd_low
    cum_v_low := 0
    cum_pv_low := 0

cum_v_low += volume
cum_pv_low += close * volume
if cum_v_low != 0
    vwap_low := cum_pv_low / cum_v_low

// Check for new high-volume candle that is also abnormally high and reset cumulative variables for high-volume VWAP
new_high_volume = false
if volume > highest_volume and volume > volume_threshold * avg_volume
    highest_volume := volume
    cum_v_high_volume := 0
    cum_pv_high_volume := 0
    new_high_volume := true

cum_v_high_volume += volume
cum_pv_high_volume += close * volume
if cum_v_high_volume != 0
    vwap_high_volume := cum_pv_high_volume / cum_v_high_volume

// Plot VWAPs
plot(vwap_open, color=color.red, linewidth=2, title="VWAP Open")
plot(vwap_high, color=color.green, linewidth=2, title="VWAP High")
plot(vwap_low, color=color.blue, linewidth=2, title="VWAP Low")
plot(vwap_high_volume, color=color.purple, linewidth=2, title="VWAP High Volume")

// Plot a vertical line on the chart only when a new high-volume VWAP anchor occurs
bgcolor(new_high_volume ? color.new(color.purple, 90) : na, offset=-1)

// Calculate displacement amounts
displacement_amount_open = vwap_open * displacement_percentage
displacement_amount_high = vwap_high * displacement_percentage
displacement_amount_low = vwap_low * displacement_percentage
displacement_amount_high_volume = vwap_high_volume * displacement_percentage

// Check for gaps on the opposite side of a VWAP
gap_up_opposite_open = na(close[1]) ? false : (open > close[1] and open < vwap_open and close[1] > vwap_open)
gap_down_opposite_open = na(close[1]) ? false : (open < close[1] and open > vwap_open and close[1] < vwap_open)

gap_up_opposite_high = na(close[1]) ? false : (open > close[1] and open < vwap_high and close[1] > vwap_high)
gap_down_opposite_high = na(close[1]) ? false : (open < close[1] and open > vwap_high and close[1] < vwap_high)

gap_up_opposite_low = na(close[1]) ? false : (open > close[1] and open < vwap_low and close[1] > vwap_low)
gap_down_opposite_low = na(close[1]) ? false : (open < close[1] and open > vwap_low and close[1] < vwap_low)

gap_up_opposite_high_volume = na(close[1]) ? false : (open > close[1] and open < vwap_high_volume and close[1] > vwap_high_volume)
gap_down_opposite_high_volume = na(close[1]) ? false : (open < close[1] and open > vwap_high_volume and close[1] < vwap_high_volume)

// RSI calculation for momentum change detection
rsi = ta.rsi(close, 14)
long_exit_condition = rsi > 70
short_exit_condition = rsi < 30

// Debugging Plots
plotshape(not gap_up_opposite_open and not gap_down_opposite_open and close > vwap_open and low < vwap_open - displacement_amount_open and close[1] < vwap_open, style=shape.triangledown, location=location.abovebar, color=color.red, size=size.small, title="Open Long Signal")
plotshape(not gap_up_opposite_open and not gap_down_opposite_open and close < vwap_open and high > vwap_open + displacement_amount_open and close[1] > vwap_open, style=shape.triangleup, location=location.belowbar, color=color.green, size=size.small, title="Open Short Signal")

plotshape(not gap_up_opposite_high and not gap_down_opposite_high and close > vwap_high and low < vwap_high - displacement_amount_high and close[1] < vwap_high, style=shape.triangledown, location=location.abovebar, color=color.blue, size=size.small, title="High Long Signal")
plotshape(not gap_up_opposite_high and not gap_down_opposite_high and close < vwap_high and high > vwap_high + displacement_amount_high and close[1] > vwap_high, style=shape.triangleup, location=location.belowbar, color=color.orange, size=size.small, title="High Short Signal")

plotshape(not gap_up_opposite_low and not gap_down_opposite_low and close > vwap_low and low < vwap_low - displacement_amount_low and close[1] < vwap_low, style=shape.triangledown, location=location.abovebar, color=color.purple, size=size.small, title="Low Long Signal")
plotshape(not gap_up_opposite_low and not gap_down_opposite_low and close < vwap_low and high > vwap_low + displacement_amount_low and close[1] > vwap_low, style=shape.triangleup, location=location.belowbar, color=color.yellow, size=size.small, title="Low Short Signal")

plotshape(not gap_up_opposite_high_volume and not gap_down_opposite_high_volume and close > vwap_high_volume and low < vwap_high_volume - displacement_amount_high_volume and close[1] < vwap_high_volume, style=shape.triangledown, location=location.abovebar, color=color.teal, size=size.small, title="High Volume Long Signal")
plotshape(not gap_up_opposite_high_volume and not gap_down_opposite_high_volume and close < vwap_high_volume and high > vwap_high_volume + displacement_amount_high_volume and close[1] > vwap_high_volume, style=shape.triangleup, location=location.belowbar, color=color.fuchsia, size=size.small, title="High Volume Short Signal")

// Trading signals based on VWAP support/resistance with displacement, no gaps on the opposite side, and bounce conditions
if not gap_up_opposite_open and not gap_down_opposite_open
    if (close > vwap_open and low < vwap_open)
        if close > open
            strategy.entry("Long_Open_Wick", strategy.long, comment="Wick")
        else
            strategy.entry("Long_Open_Crossover", strategy.long, comment="Crossover")
    
    if (close < vwap_open and high > vwap_open)
        if close < open
            strategy.entry("Short_Open_Wick", strategy.short, comment="Wick")
        else
            strategy.entry("Short_Open_Crossover", strategy.short, comment="Crossover")

if not gap_up_opposite_high and not gap_down_opposite_high
    if (close > vwap_high and low < vwap_high)
        if close > open
            strategy.entry("Long_High_Wick", strategy.long, comment="Wick")
        else
            strategy.entry("Long_High_Crossover", strategy.long, comment="Crossover")
    
    if (close < vwap_high and high > vwap_high)
        if close < open
            strategy.entry("Short_High_Wick", strategy.short, comment="Wick")
        else
            strategy.entry("Short_High_Crossover", strategy.short, comment="Crossover")

if not gap_up_opposite_low and not gap_down_opposite_low
    if (close > vwap_low and low < vwap_low)
        if close > open
            strategy.entry("Long_Low_Wick", strategy.long, comment="Wick")
        else
            strategy.entry("Long_Low_Crossover", strategy.long, comment="Crossover")
    
    if (close < vwap_low and high > vwap_low)
        if close < open
            strategy.entry("Short_Low_Wick", strategy.short, comment="Wick")
        else
            strategy.entry("Short_Low_Crossover", strategy.short, comment="Crossover")

if not gap_up_opposite_high_volume and not gap_down_opposite_high_volume
    if (close > vwap_high_volume and low < vwap_high_volume)
        if close > open
            strategy.entry("Long_High_Volume_Wick", strategy.long, comment="Wick")
        else
            strategy.entry("Long_High_Volume_Crossover", strategy.long, comment="Crossover")
    
    if (close < vwap_high_volume and high > vwap_high_volume)
        if close < open
            strategy.entry("Short_High_Volume_Wick", strategy.short, comment="Wick")
        else
            strategy.entry("Short_High_Volume_Crossover", strategy.short, comment="Crossover")

// Exit trades based on RSI momentum change
if strategy.position_size > 0 and long_exit_condition
    strategy.close("Long_Open_Wick")
    strategy.close("Long_Open_Crossover")
    strategy.close("Long_High_Wick")
    strategy.close("Long_High_Crossover")
    strategy.close("Long_Low_Wick")
    strategy.close("Long_Low_Crossover")
    strategy.close("Long_High_Volume_Wick")
    strategy.close("Long_High_Volume_Crossover")

if strategy.position_size < 0 and short_exit_condition
    strategy.close("Short_Open_Wick")
    strategy.close("Short_Open_Crossover")
    strategy.close("Short_High_Wick")
    strategy.close("Short_High_Crossover")
    strategy.close("Short_Low_Wick")
    strategy.close("Short_Low_Crossover")
    strategy.close("Short_High_Volume_Wick")
    strategy.close("Short_High_Volume_Crossover")