Strategi Pembalikan Bar Pin Ditapis Trend

Gambaran keseluruhan
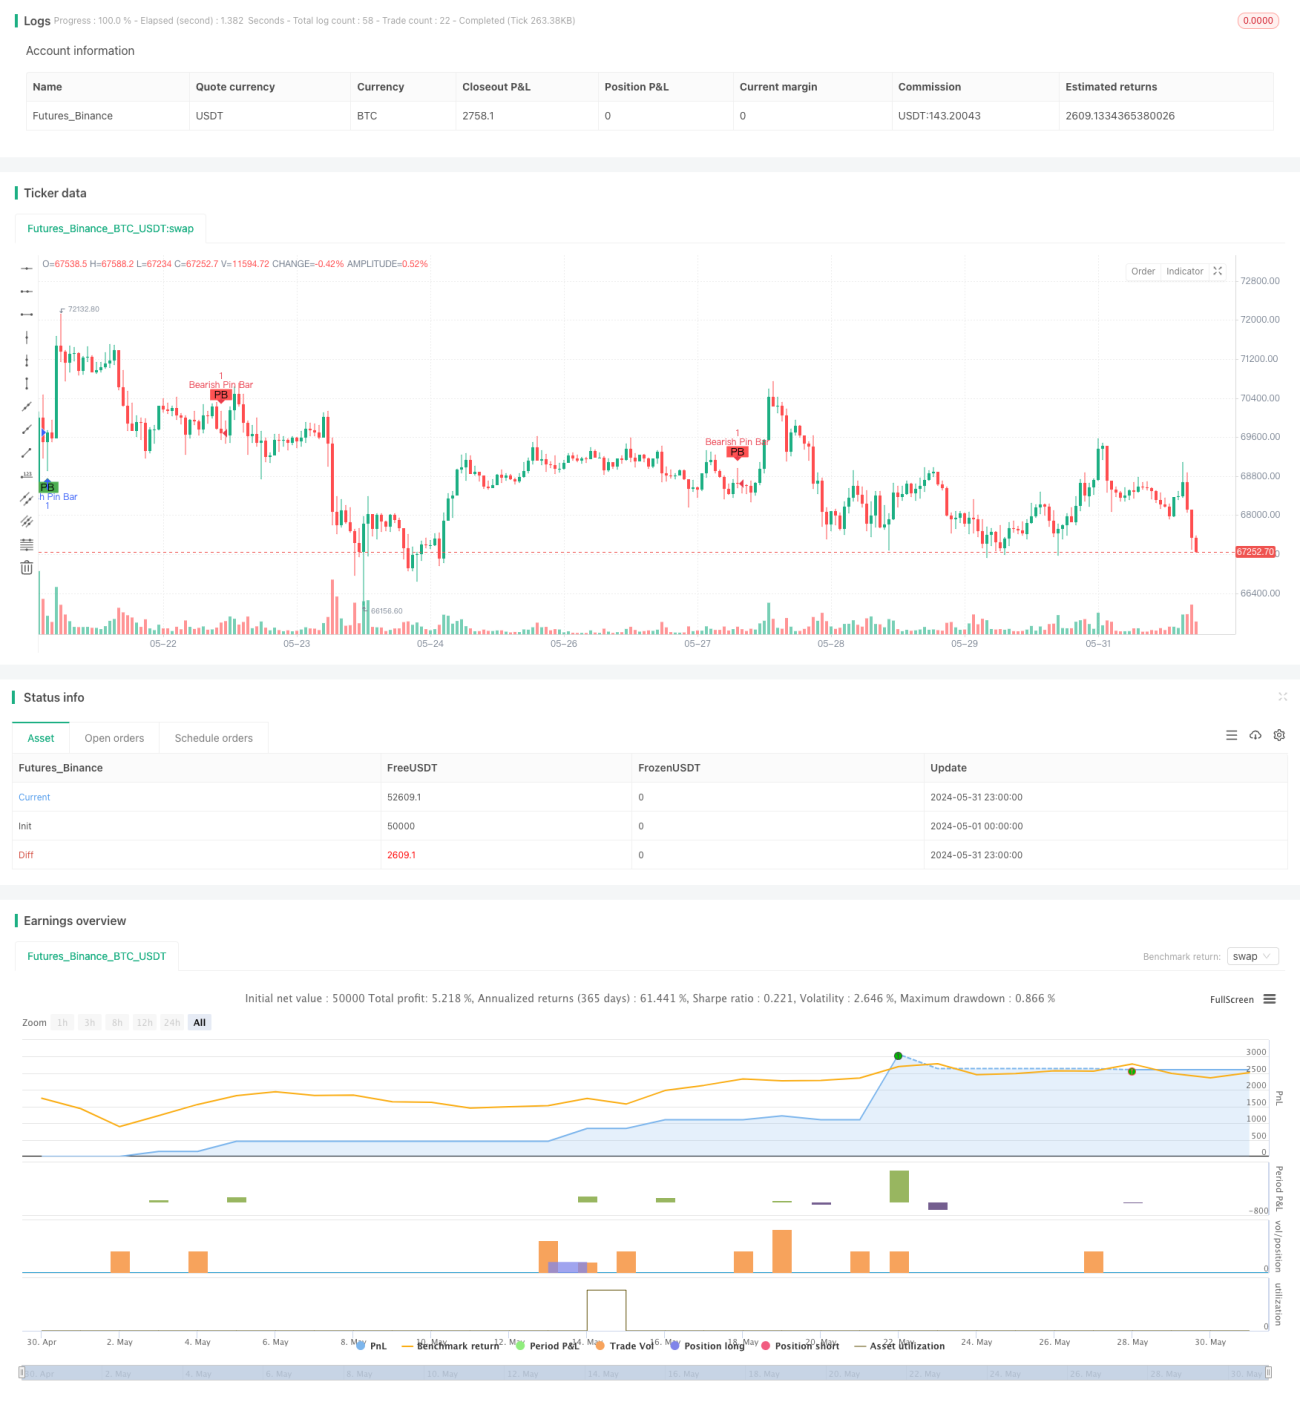
Strategi ini digunakan untuk menentukan arah trend semasa dengan menggunakan 50 kitaran purata bergerak sederhana (SMA) dan menggunakan 20 kitaran SMA sebagai syarat penapisan jumlah dagangan, hanya apabila jumlah dagangan lebih besar daripada garis rata-rata ini berlaku yang dianggap sebagai isyarat yang berkesan. Di samping itu, strategi ini juga mengira indikator RSI yang agak kuat (RSI), tetapi tidak digunakan secara langsung dalam keadaan masuk dan keluar, tetapi sebagai syarat untuk isyarat yang boleh dipilih lebih lanjut.
Prinsip Strategi
- Pertama, untuk menilai saiz nisbah bar Pin dan entiti, garis atas atau bawah mestilah sekurang-kurangnya 60% dari keseluruhan garis K, dan bahagian entiti tidak boleh melebihi 30%.
- Pin Bar adalah bullish atau bearish dengan membandingkan saiz harga penutupan dan harga pembukaan.
- Menggunakan 50 kitaran SMA untuk menilai trend semasa, apabila harga penutupan di atas SMA dianggap sebagai trend naik, sebaliknya sebagai trend menurun.
- Dengan 20 kitaran perdagangan SMA sebagai had syarat penapisan jumlah perdagangan, hanya apabila Pin Bar dilaksanakan, jumlah perdagangan yang lebih besar daripada nilai ini dianggap sebagai isyarat yang sah.
- Gambarkan penanda harga dan penanda harga Pin Bar.
- Buka kedudukan lebih tinggi apabila Pin Bar muncul, buka kedudukan kosong apabila Pin Bar muncul.
- Penangguhan berhenti adalah 2 kali ganda saiz entiti Pin Bar, penangguhan berhenti adalah 3 kali ganda. Penangguhan berhenti berbilang terletak di bawah titik terendah Pin Bar, penangguhan berhenti terletak di atas titik tertinggi; kepala kosong sebaliknya.
Analisis kelebihan
- Pin Bar adalah bentuk pembalikan harga yang sangat intuitif dan berkesan yang dapat menangkap perubahan sentimen pasaran dengan lebih tepat.
- Keadaan penapisan trend dapat memastikan bahawa isyarat Pin Bar sesuai dengan arah trend semasa, meningkatkan kemenangan isyarat dengan ketara.
- Keadaan jumlah dagangan dapat menyaring bunyi pasaran yang kurang likuid dan memastikan bahawa isyarat Pin Bar mempunyai penyertaan pasaran yang mencukupi.
- Tetapan untuk kedudukan stop loss dan stop stop adalah berdasarkan ciri-ciri Pin Bar itu sendiri, dengan risiko dan keuntungan yang munasabah.
- Kod logik dan peraturan jelas, mudah difahami dan dilaksanakan.
Analisis risiko
- Kebolehpercayaan isyarat Pin Bar akan mengalami penurunan yang ketara dalam pasaran yang bergolak, di mana penapis trend tidak berfungsi.
- Pin Bar juga mungkin tidak berfungsi apabila berlaku insiden pesawat terbang atau Lido.
- Ia juga boleh menyebabkan kemerosotan dalam jumlah sampel yang diambil.
- Parameter lalai mungkin memerlukan pengoptimuman lanjut untuk varieti dan kitaran tertentu.
- Sistem isyarat tunggal secara keseluruhan lebih berisiko.
Arah pengoptimuman
- Anda boleh mempertimbangkan untuk memperkenalkan bentuk pembalikan lain seperti Bar dalaman untuk memperkaya sumber isyarat.
- Kedudukan hentian dan hentian boleh disesuaikan secara dinamik dengan indikator kadar turun naik seperti ATR untuk menyesuaikan diri dengan keadaan pasaran yang berbeza.
- Ia juga boleh digunakan untuk mengesan peratusan kerugian.
- Anda boleh menambah lebih banyak data asas seperti kalendar ekonomi dan peristiwa-peristiwa penting untuk menyaring isyarat yang mungkin tidak berkesan.
- Pertimbangkan untuk memperkenalkan modul pengurusan wang untuk mengawal risiko setiap transaksi.
ringkaskan
Strategi pembalikan pin bar menggunakan pemikiran yang mudah dan berkesan, meningkatkan ketepatan pengenalan isyarat melalui penapisan trend, penapisan jumlah transaksi dan lain-lain. Walaupun terdapat beberapa tempat yang boleh diperbaiki pada masa ini, pemikiran keseluruhan adalah praktikal dan bernilai ujian pengoptimuman lanjut. Pin bar sendiri sebagai bentuk harga klasik, boleh juga digunakan bersama-sama dengan indikator atau isyarat lain untuk mendapatkan sistem perdagangan yang lebih mantap.
- 1