Strategi Trend RSI

Gambaran keseluruhan
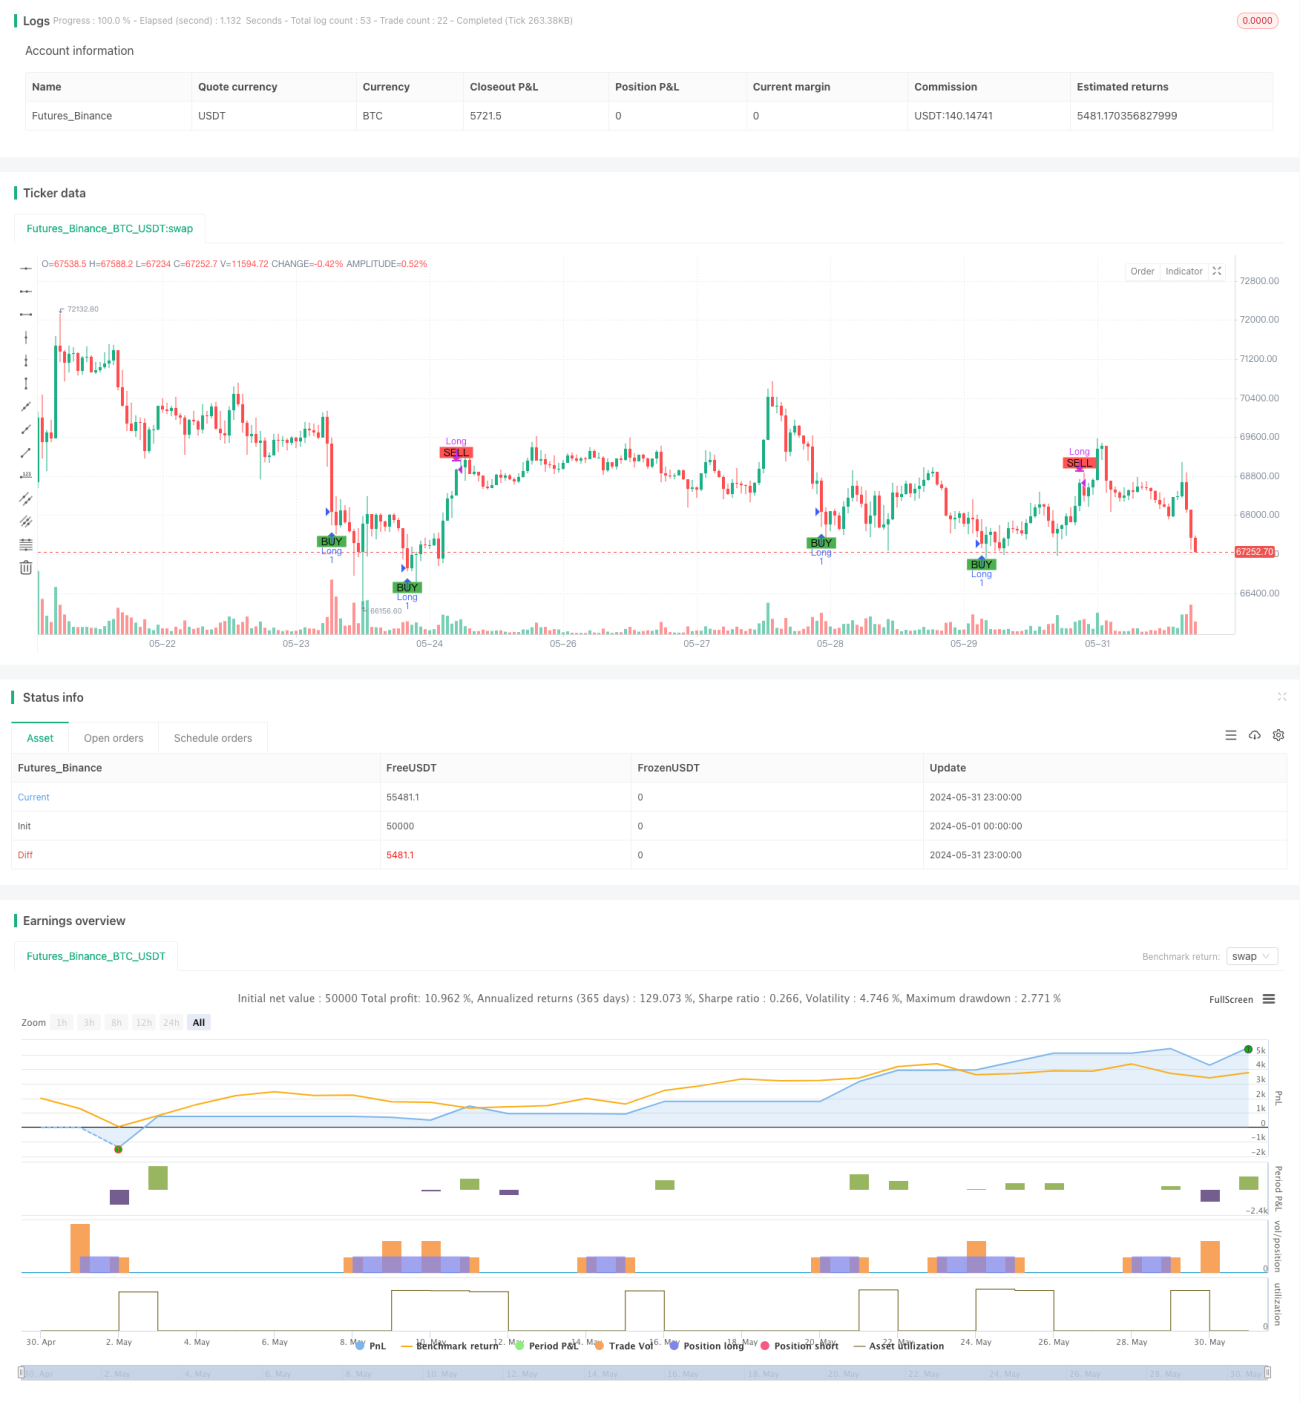
Strategi ini berdasarkan pada indeks relatif kuat dan lemah (RSI) untuk menentukan isyarat beli dan jual dengan menilai sama ada nilai RSI melebihi paras naik dan turun yang ditetapkan. Strategi ini juga menetapkan had waktu berhenti dan memegang kedudukan untuk mengawal risiko.
Prinsip Strategi
- Hitung nilai RSI.
- Sinyal beli dihasilkan apabila nilai RSI lebih rendah daripada had pembelian yang ditetapkan; Sinyal jual dihasilkan apabila nilai RSI lebih tinggi daripada had jualan yang ditetapkan.
- Mengikut isyarat beli, jumlah beli dikira pada harga penutupan semasa, dan pesanan beli.
- Jika anda menetapkan nisbah stop loss, anda akan mengira harga stop loss dan membuat pesanan stop loss.
- Semua pemegang kedudukan kosong di bawah isyarat jual atau terhad.
- Jika anda menetapkan masa pegangan maksimum, selepas masa pegangan melebihi masa pegangan maksimum, semua pegangan akan dipadamkan, tidak kira keuntungan atau kerugian.
Kelebihan Strategik
- RSI merupakan satu indikator analisis teknikal yang digunakan secara meluas dan berkesan untuk menangkap isyarat pasaran yang terlalu beli dan terlalu jual.
- Strategi ini memperkenalkan sekatan kerugian dan jangka masa untuk membantu mengawal risiko.
- Logik strategi jelas, mudah difahami dan dilaksanakan.
- Dengan menyesuaikan parameter dan nilai had RSI, ia dapat disesuaikan dengan keadaan pasaran yang berbeza.
Risiko Strategik
- RSI mungkin memberi isyarat yang salah dalam keadaan tertentu, menyebabkan strategi mengalami kerugian.
- Strategi ini tidak mengambil kira faktor asas dalam jenis perdagangan dan hanya bergantung pada petunjuk teknikal, yang mungkin menghadapi risiko kejutan pasaran.
- Peratusan kerugian tetap mungkin tidak dapat menyesuaikan diri dengan perubahan turun naik pasaran.
- Prestasi strategi mungkin dipengaruhi oleh tetapan parameter, parameter yang tidak sesuai boleh menyebabkan prestasi strategi yang buruk.
Arah pengoptimuman strategi
- Pengenalan penunjuk teknikal lain, seperti purata bergerak, untuk meningkatkan kebolehpercayaan strategi.
- Optimumkan strategi hentian kerugian, seperti hentian bergerak atau hentian dinamik berdasarkan kadar turun naik.
- Parameter dan nilai terhad RSI disesuaikan secara dinamik mengikut keadaan pasaran.
- Menggabungkan analisis asas jenis perdagangan untuk meningkatkan keupayaan kawalan risiko strategi.
- Kaedah ini digunakan untuk mengkaji semula dan mengoptimumkan parameter untuk mencari kombinasi parameter yang terbaik.
ringkaskan
Strategi ini menggunakan indikator RSI untuk menangkap isyarat overbought dan oversold di pasaran, sambil memperkenalkan had waktu berhenti dan memegang untuk mengawal risiko. Logik strategi mudah difahami, mudah dilaksanakan dan dioptimumkan. Walau bagaimanapun, prestasi strategi mungkin dipengaruhi oleh turun naik dan parameter pasaran, dan oleh itu perlu digabungkan dengan kaedah analisis lain dan kaedah pengurusan risiko untuk meningkatkan kehandalan dan keuntungan strategi.
/*backtest
start: 2024-05-01 00:00:00
end: 2024-05-31 23:59:59
period: 1h
basePeriod: 15m
exchanges: [{"eid":"Futures_Binance","currency":"BTC_USDT"}]
*/

//@version=5
strategy("Simple RSI Strategy", overlay=true,  initial_capital=20, commission_value=0.1, commission_type=strategy.commission.percent)

// Define the hardcoded date (Year, Month, Day, Hour, Minute)- 1