G Trend EMA ATR Strategi Perdagangan Pintar

Gambaran keseluruhan
Strategi ini menggunakan indikator G-channel untuk mengenal pasti arah trend pasaran, sambil menggabungkan indikator EMA dan ATR untuk mengoptimumkan titik masuk dan keluar. Gagasan utama strategi ini adalah: apabila harga menembusi saluran G dan melakukan lebih banyak di bawah EMA, menembusi saluran G dan kosong di atas EMA.
Prinsip Strategi
- Hitung saluran G atas dan bawah: Hitung saluran G atas dan bawah menggunakan harga penutupan semasa dan harga terendah sebelum harga tertinggi.
- Menghakimi arah trend: Menghakimi trend plurality dengan memerhatikan hubungan antara harga dan aliran naik dan turun saluran G.
- Hitung EMA: Hitung nilai EMA untuk tempoh yang ditetapkan.
- Hitung ATR: Hitung nilai ATR untuk tempoh yang ditetapkan.
- Untuk menilai keadaan jual beli: apabila harga menembusi saluran G dan berada di bawah EMA, ia akan mencetuskan kenaikan harga, dan apabila ia menembusi saluran G dan berada di atas EMA, ia akan mencetuskan penurunan harga.
- Tetapkan stop loss: stop loss adalah harga pembukaan kedudukan - 2 kali ATR, stop loss adalah harga pembukaan kedudukan + 4 kali ATR ((banyak kepala); stop loss adalah harga pembukaan kedudukan + 2 kali ATR, stop loss adalah harga pembukaan kedudukan - 4 kali ATR ((kepala kosong) <unk>
- Trigger strategi: melaksanakan operasi bukaan kedudukan yang sesuai apabila syarat membeli dan menjual dipenuhi, dan menetapkan Hentikan Kerugian yang sesuai.
Kelebihan Strategik
- Pengesanan Trend: Strategi menggunakan saluran G untuk menangkap trend pasaran dengan berkesan, sesuai dengan keadaan trend.
- Hentian Hentian Dinamis: Menggunakan ATR untuk menyesuaikan Hentian Hentian Dinamis, yang dapat menyesuaikan diri dengan lebih baik dengan turun naik pasaran.
- Kawalan risiko: Stop loss ditetapkan pada 2 kali ATR, mengawal risiko setiap dagangan.
- Sederhana dan mudah digunakan: Strategi logiknya jelas dan sesuai untuk digunakan oleh kebanyakan pelabur.
Risiko Strategik
- Keadaan yang bergolak: Dalam keadaan yang bergolak, isyarat dagangan yang kerap boleh menyebabkan kerugian meningkat.
- Pengoptimuman parameter: Perbezaan jenis dan kitaran mungkin memerlukan parameter yang berbeza, dan penggunaan secara buta boleh membawa risiko.
- Kes Swan Hitam: Dalam keadaan yang melampau, harga turun naik dengan ketara dan penutupan mungkin tidak dapat dilaksanakan dengan berkesan.
Arah pengoptimuman strategi
- Penapisan Trend: Tambah syarat penapisan trend seperti MA silang, DMI dan lain-lain, mengurangkan perdagangan dalam keadaan goyah.
- Optimasi parameter: Optimasi parameter untuk pelbagai jenis dan kitaran untuk mencari kombinasi parameter terbaik.
- Pengurusan kedudukan: menyesuaikan kedudukan mengikut pergerakan turun naik pasaran, meningkatkan penggunaan dana.
- Strategi gabungan: menggabungkan strategi ini dengan strategi lain yang berkesan untuk meningkatkan kestabilan.
ringkaskan
Strategi ini membina sistem perdagangan yang mudah dan berkesan untuk menjejaki trend melalui G channel, EMA, ATR dan lain-lain. Ia boleh mencapai kesan yang baik dalam keadaan trend, tetapi biasanya berfungsi dalam keadaan goyah. Kemudian, strategi ini dapat dioptimumkan dari segi penapisan trend, pengoptimuman parameter, pengurusan kedudukan, strategi gabungan, dan sebagainya untuk meningkatkan kehandalan dan keuntungan strategi.
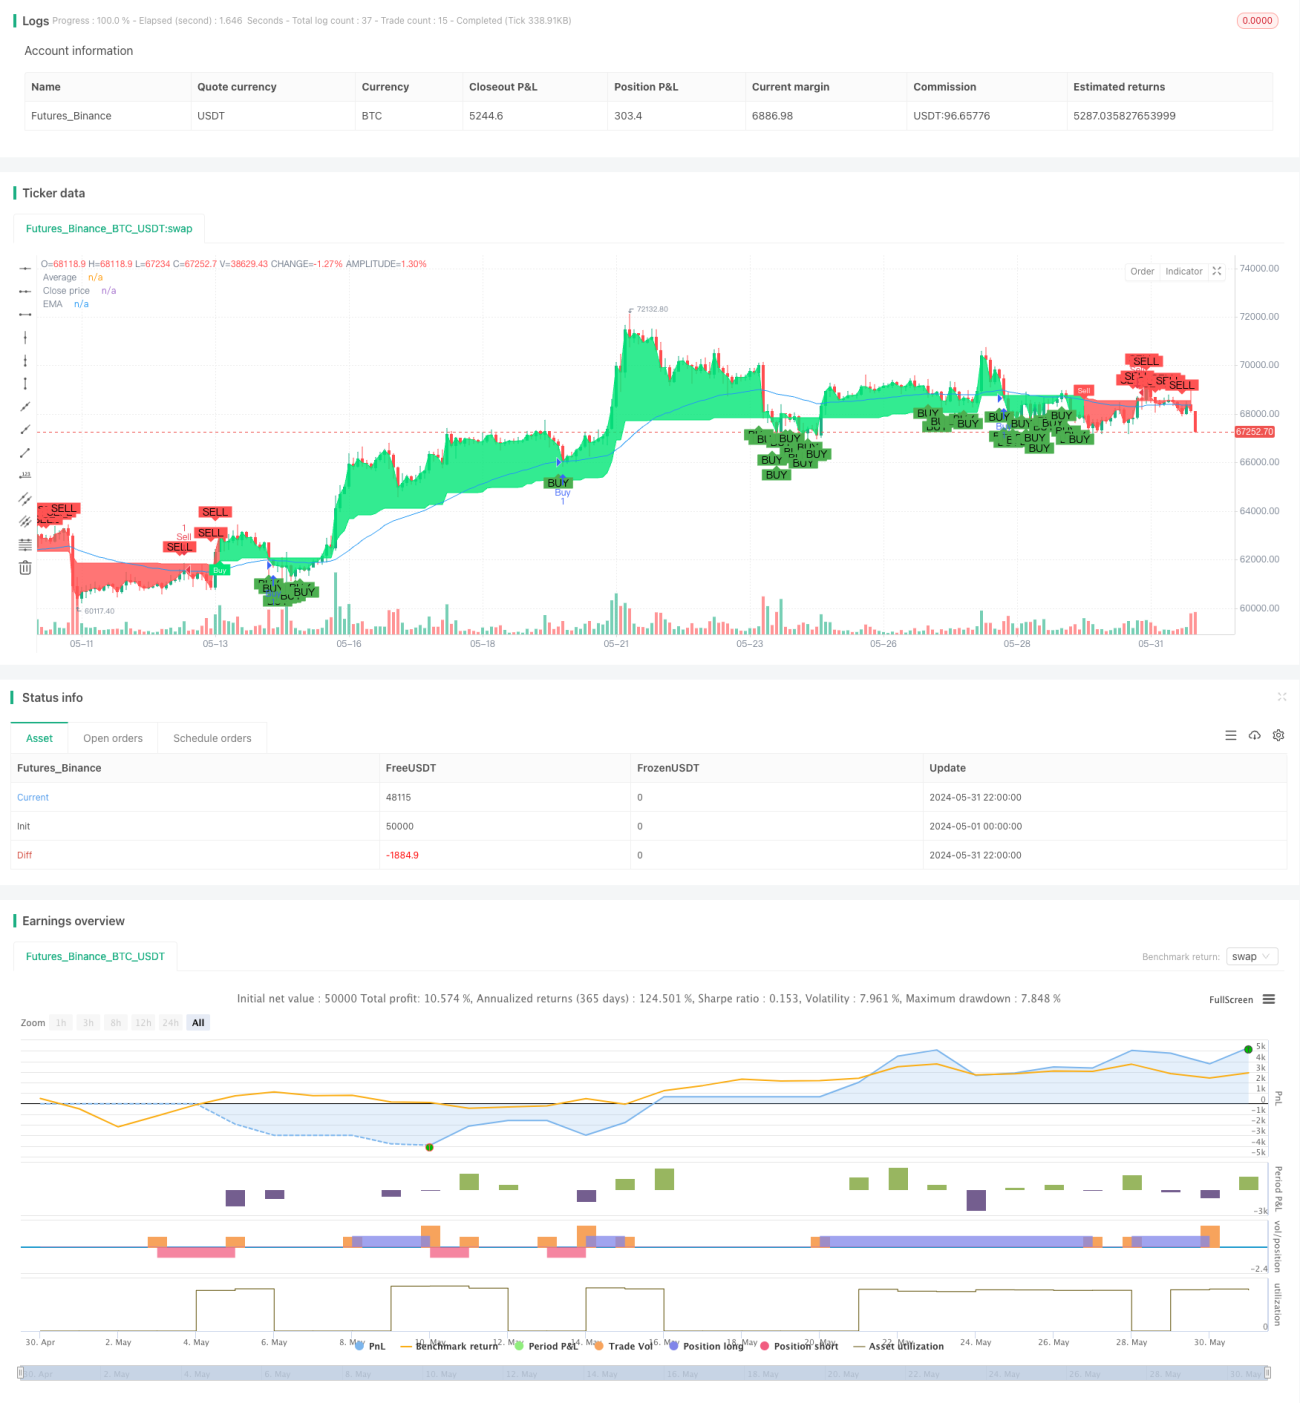
/*backtest
start: 2024-05-01 00:00:00
end: 2024-05-31 23:59:59
period: 2h
basePeriod: 15m
exchanges: [{"eid":"Futures_Binance","currency":"BTC_USDT"}]
*/

//@version=4
// Full credit to AlexGrover: https://www.tradingview.com/script/fIvlS64B-G-Channels-Efficient-Calculation-Of-Upper-Lower-Extremities/
strategy ("G-Channel Trend Detection with EMA Strategy and ATR", shorttitle="G-Trend EMA ATR Strategy", overlay=true)
- 1