EMA RSI MACD strategi dagangan henti untung dan henti rugi dinamik

1
Follow
1781
Followers
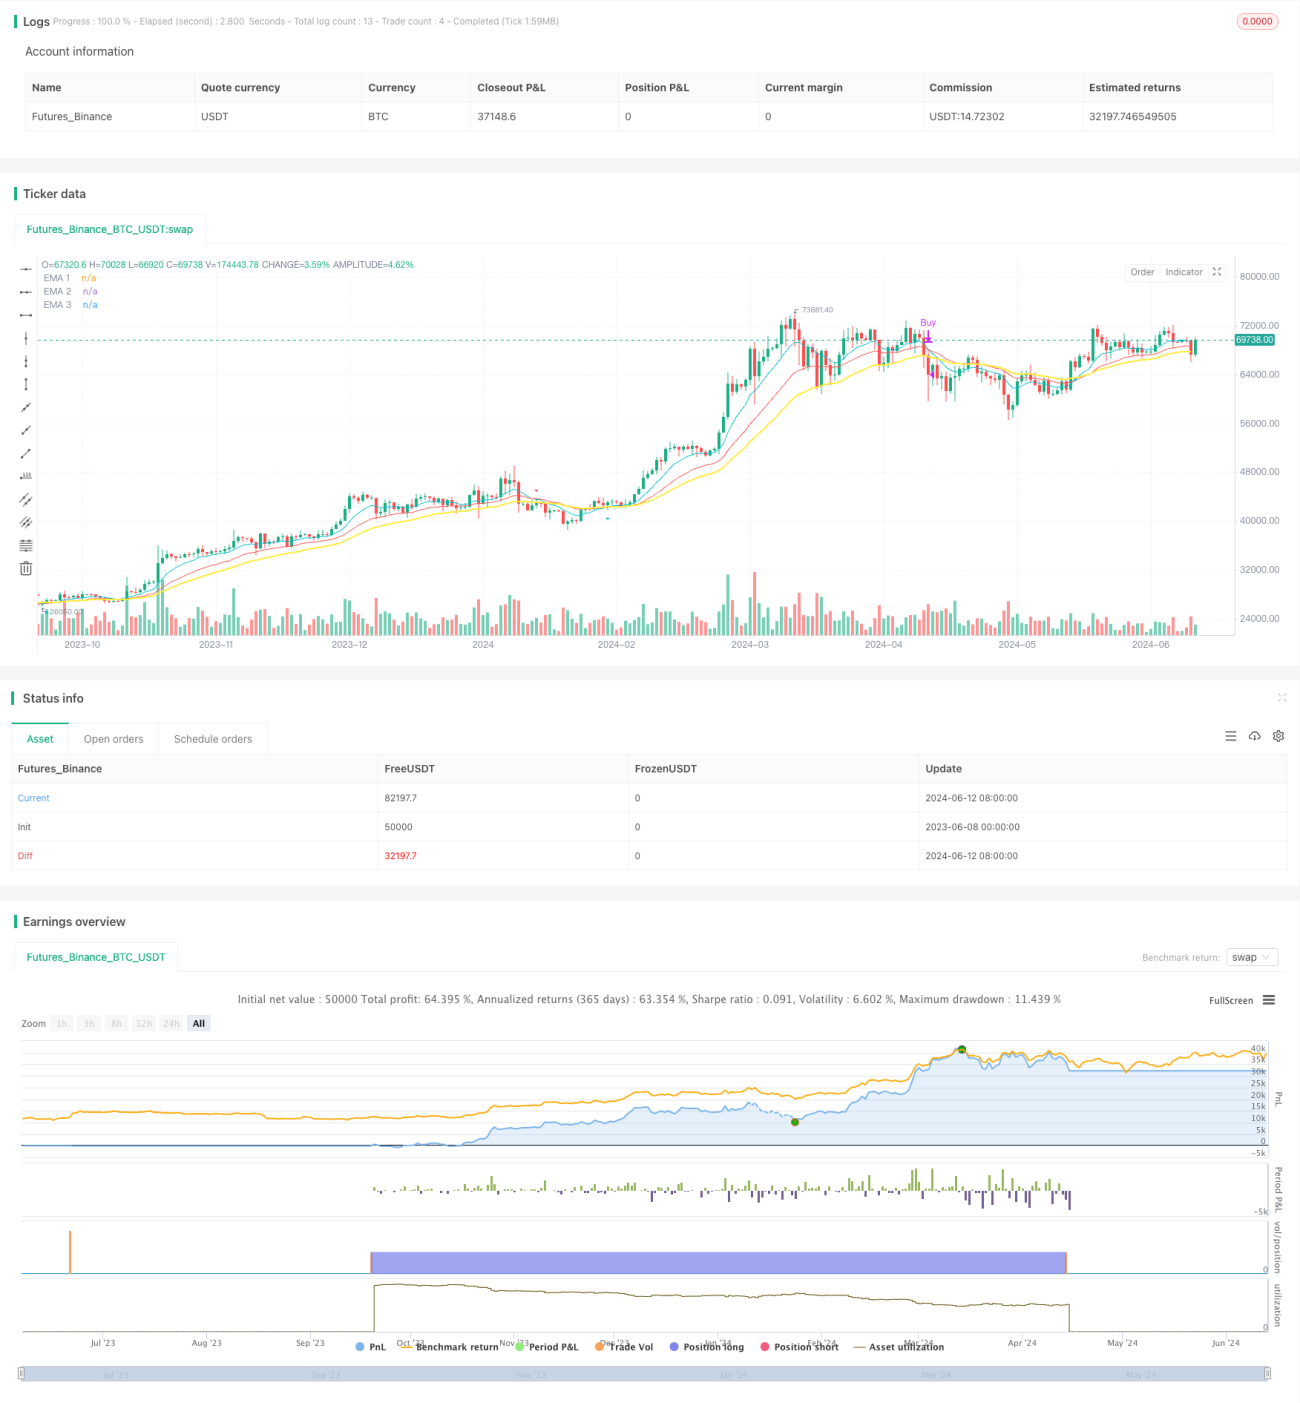
Gambaran keseluruhan
Strategi perdagangan ini menggabungkan tiga petunjuk teknikal iaitu EMA, RSI, dan MACD dengan menganalisis hubungan silang dan nilai mereka untuk menghasilkan isyarat beli dan jual apabila harga memenuhi syarat tertentu. Strategi ini juga menetapkan hentian dan hentian dinamik untuk menguruskan risiko perdagangan.
Prinsip Strategi
- Mengira purata harga penutupan yang tinggi dan rendah ((HLCC4) sebagai data asas strategi.
- Indeks EMA dan RSI berdasarkan HLCC4 yang dikira dalam tiga tempoh yang berbeza.
- Hitung nilai dari carta MACD.
- Untuk menilai persilangan antara EMA1 dan EMA2:
- Apabila EMA1 memakai EMA2, ia akan menghasilkan isyarat penyokong.
- Apabila EMA1 menembusi EMA2, ia menghasilkan isyarat penurunan.
- Mengambil kira nilai EMA, RSI dan MACD secara menyeluruh untuk menentukan sama ada syarat membeli atau menjual dipenuhi:
- Syarat pembelian: EMA1 melalui EMA2, HLCC4 lebih tinggi daripada EMA3, RSI lebih tinggi daripada penurunan, harga penutupan lebih tinggi daripada harga bukaan, carta MACD bertiang adalah positif.
- Syarat jual: EMA1 di bawah EMA2, HLCC4 di bawah EMA3, RSI di bawah nilai terhad, harga penutupan di bawah harga pembukaan, carta MACD negatif.
- Jika ada isyarat sebaliknya semasa memegang kedudukan, mulakan dengan melonggarkan kedudukan yang sedia ada, kemudian buka kedudukan baru.
- Apabila anda membeli atau menjual, anda boleh menetapkan harga hentian dan hentian kerugian berdasarkan jumlah mata yang ditetapkan.
Kelebihan Strategik
- Pengkajian gabungan pelbagai penunjuk teknikal meningkatkan kebolehpercayaan isyarat.
- Memperkenalkan mekanisme hentian hentian dinamik, yang dapat mengawal risiko dengan berkesan.
- Apabila terdapat isyarat sebaliknya, ia akan menghapuskan kedudukan asal, mengelakkan masalah memegang semula kedudukan.
- Parameter boleh laras, mudah disesuaikan, dan boleh dioptimumkan mengikut keadaan pasaran yang berbeza.
Risiko Strategik
- Dalam keadaan yang tidak menentu, persilangan yang kerap boleh menyebabkan terlalu banyak urus niaga dan meningkatkan kos bayaran.
- Penutupan berhenti dengan titik tetap mungkin tidak dapat menyesuaikan diri dengan turun naik pasaran, menyebabkan penutupan terlalu awal atau penutupan terlalu lewat.
- Strategi ini bergantung kepada data sejarah, dan mungkin tidak bertindak balas dengan segera terhadap kejadian yang tidak dijangka atau tindakan yang tidak biasa.
Arah pengoptimuman strategi
- Anda boleh mempertimbangkan untuk memperkenalkan lebih banyak petunjuk teknikal atau sentimen pasaran, seperti Brinks, ATR, dan lain-lain, untuk meningkatkan ketepatan isyarat.
- Untuk hentikan hentikan, anda boleh menggunakan cara yang lebih dinamik, seperti mengesan hentikan atau menyesuaikan jarak hentikan hentikan mengikut kadar turun naik.
- Ia boleh digabungkan dengan analisis asas, seperti peristiwa berita utama, data ekonomi yang dikeluarkan, dan sebagainya, untuk menapis isyarat perdagangan dan mengelakkan perdagangan pada masa-masa istimewa.
- Untuk menetapkan parameter, algoritma pembelajaran mesin atau pengoptimuman boleh digunakan untuk mencari kombinasi parameter yang optimum.
ringkaskan
Strategi ini menggabungkan beberapa petunjuk teknikal seperti EMA, RSI, dan MACD untuk membentuk satu sistem perdagangan yang lengkap. Dalam keadaan yang sedang tren, strategi ini dapat menangkap trend dengan berkesan dan mengawal risiko dengan menghentikan kerugian secara dinamik. Tetapi dalam keadaan yang goyah, perdagangan yang kerap mungkin mempengaruhi hasil.
Source
Pine
Strategy parameters
Related strategies
Comment
All comments (0)
No data
- 1