Strategi keadaan kemasukan lanjutan berdasarkan purata bergerak, rintangan sokongan dan volum

Gambaran keseluruhan
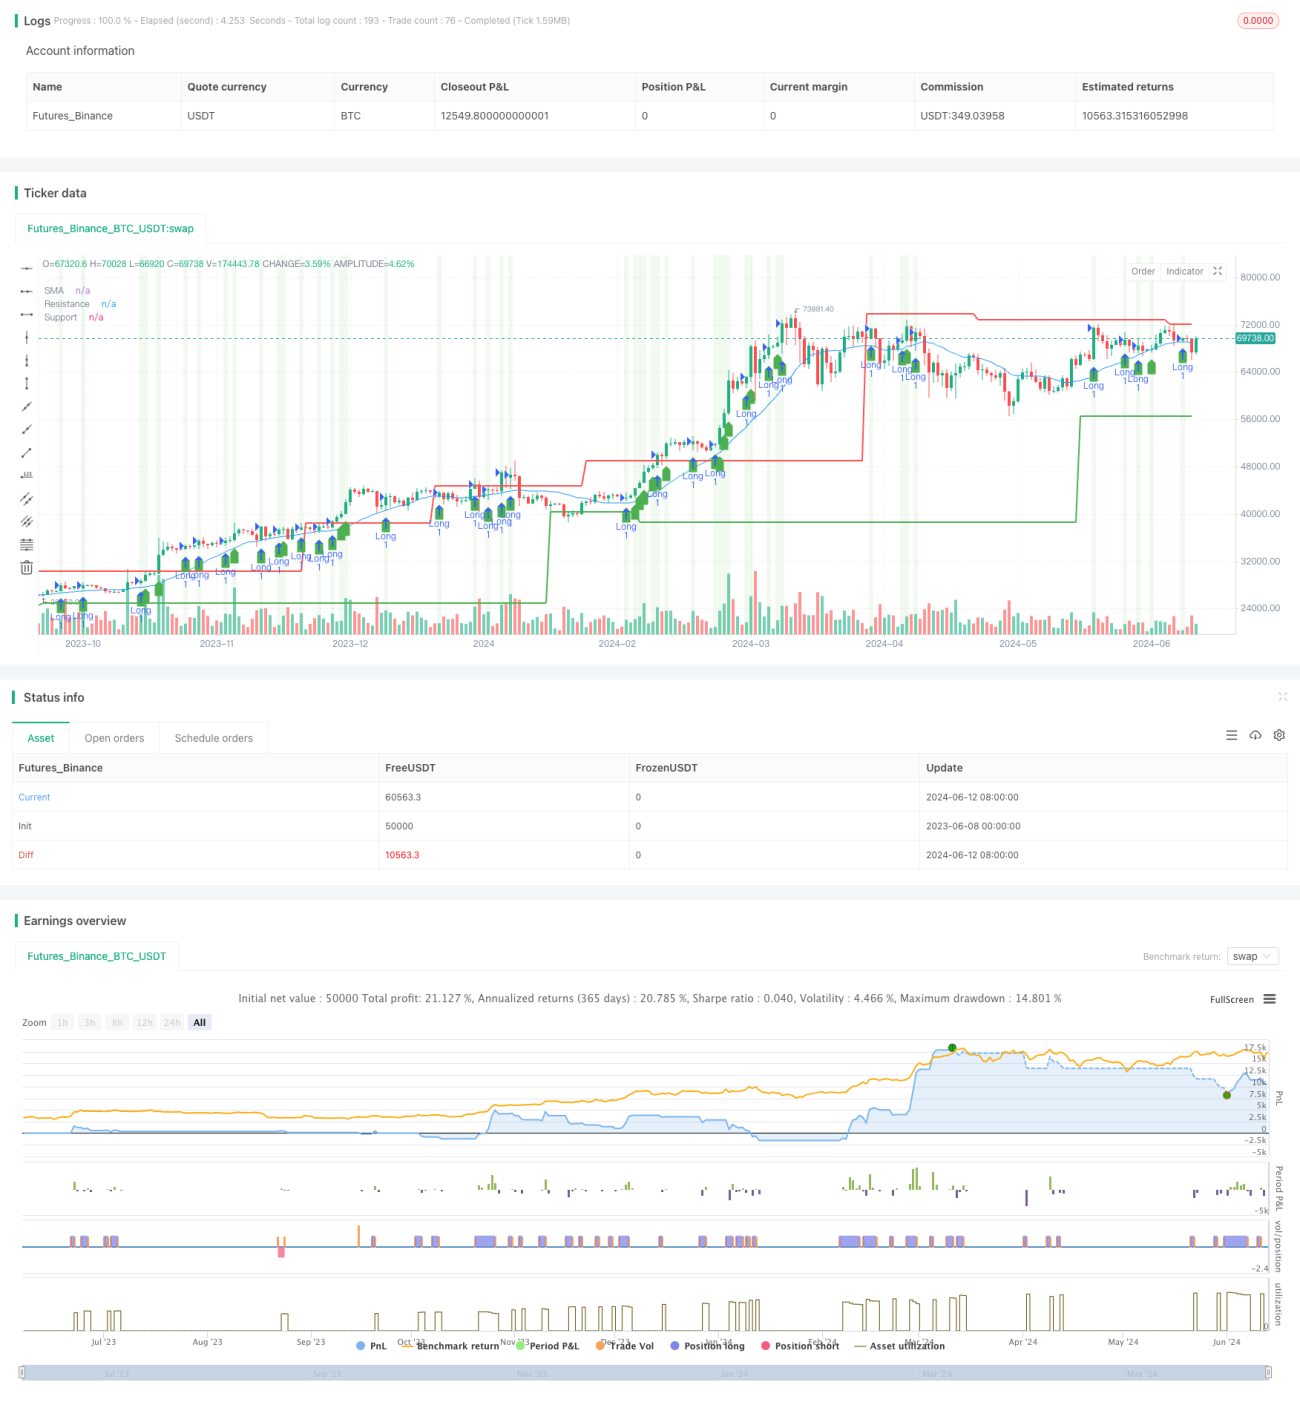
Strategi ini menggabungkan tiga petunjuk teknikal iaitu rata-rata bergerak sederhana (SMA), sokongan rintangan dan peningkatan jumlah perdagangan, untuk membina strategi perdagangan yang komprehensif. Idea utama strategi ini adalah untuk berdagang apabila harga menembusi garis rata-rata SMA, sokongan rintangan dan disertai dengan peningkatan jumlah perdagangan, sambil menetapkan syarat-syarat berhenti untuk mengawal risiko.
Prinsip Strategi
- Hitung garis rata-rata SMA, sokongan dan rintangan untuk tempoh yang ditetapkan.
- Untuk menilai sama ada jumlah dagangan semasa meningkat berbanding tempoh sebelumnya.
- Syarat kemasukan berbilang mata: harga penutupan semasa lebih besar daripada harga penutupan kitaran sebelumnya, dan lebih besar daripada garis rata-rata SMA dan sokongan, sementara harga berada pada jarak tertentu dari titik rintangan, dan disertai dengan peningkatan jumlah perdagangan.
- Syarat kemasukan kosong: harga penutupan semasa lebih rendah daripada harga penutupan kitaran sebelumnya, dan lebih rendah daripada garis rata-rata dan sokongan SMA, sementara harga berada pada jarak tertentu dari titik rintangan, dan disertai dengan peningkatan jumlah dagangan.
- Syarat-syarat Hentian: Harga Hentian Berbilang Kepala kalikan dengan harga Masuk (((1+ peratus Hentian))
Analisis kelebihan
- Ia adalah strategi yang lebih dipercayai dan lebih stabil apabila ia digabungkan dengan pelbagai petunjuk teknikal.
- Dalam pada itu, pertimbangkan harga untuk menembusi garis rata-rata SMA dan sokongan rintangan, untuk menangkap peluang trend yang lebih baik.
- Pengenalan penunjuk jumlah urus niaga untuk memastikan harga terobosan disertai dengan penyertaan pasaran yang mencukupi, meningkatkan keberkesanan isyarat.
- Tetapkan syarat-syarat Hentikan Kerosakan, mengawal risiko perdagangan dengan berkesan.
Analisis risiko
- Pengiraan untuk menyokong tahap rintangan bergantung kepada data sejarah dan mungkin tidak berkesan jika terdapat turun naik besar di pasaran.
- Indeks jumlah dagangan mungkin mengalami turun naik yang tidak normal, menyebabkan isyarat yang salah.
- Tetapan keadaan berhenti kerugian mungkin tidak dapat sepenuhnya mengelakkan kerugian dalam keadaan pasaran yang melampau.
Arah pengoptimuman
- Pertimbangkan untuk memperkenalkan petunjuk teknikal lain, seperti RSI atau MACD, untuk lebih mengesahkan kebolehpercayaan isyarat perdagangan.
- Mengoptimumkan kaedah pengiraan untuk menyokong titik rintangan, seperti menggunakan kaedah yang lebih dinamik untuk menyesuaikan diri dengan keadaan pasaran yang berbeza.
- Pengendalian yang lancar terhadap petunjuk jumlah dagangan untuk mengurangkan kesan perubahan yang luar biasa terhadap strategi.
- Tetapan untuk mengoptimumkan keadaan hentian, seperti menggunakan hentian bergerak atau menyesuaikan peratusan hentian secara dinamik mengikut pergerakan pasaran.
ringkaskan
Strategi ini membina strategi perdagangan yang komprehensif dengan menggabungkan garis rata-rata SMA, penyokong rintangan dan penunjuk jumlah perdagangan. Kelebihan strategi ini adalah dapat menangkap peluang yang sedang tren, sambil mengawal risiko perdagangan. Walau bagaimanapun, strategi ini juga mempunyai beberapa batasan, seperti kemampuan untuk menyesuaikan diri dengan keadaan pasaran yang melampau.
- 1