Strategi penembusan intrahari berdasarkan titik tinggi dan rendah garis K tiga minit

1
Follow
1781
Followers
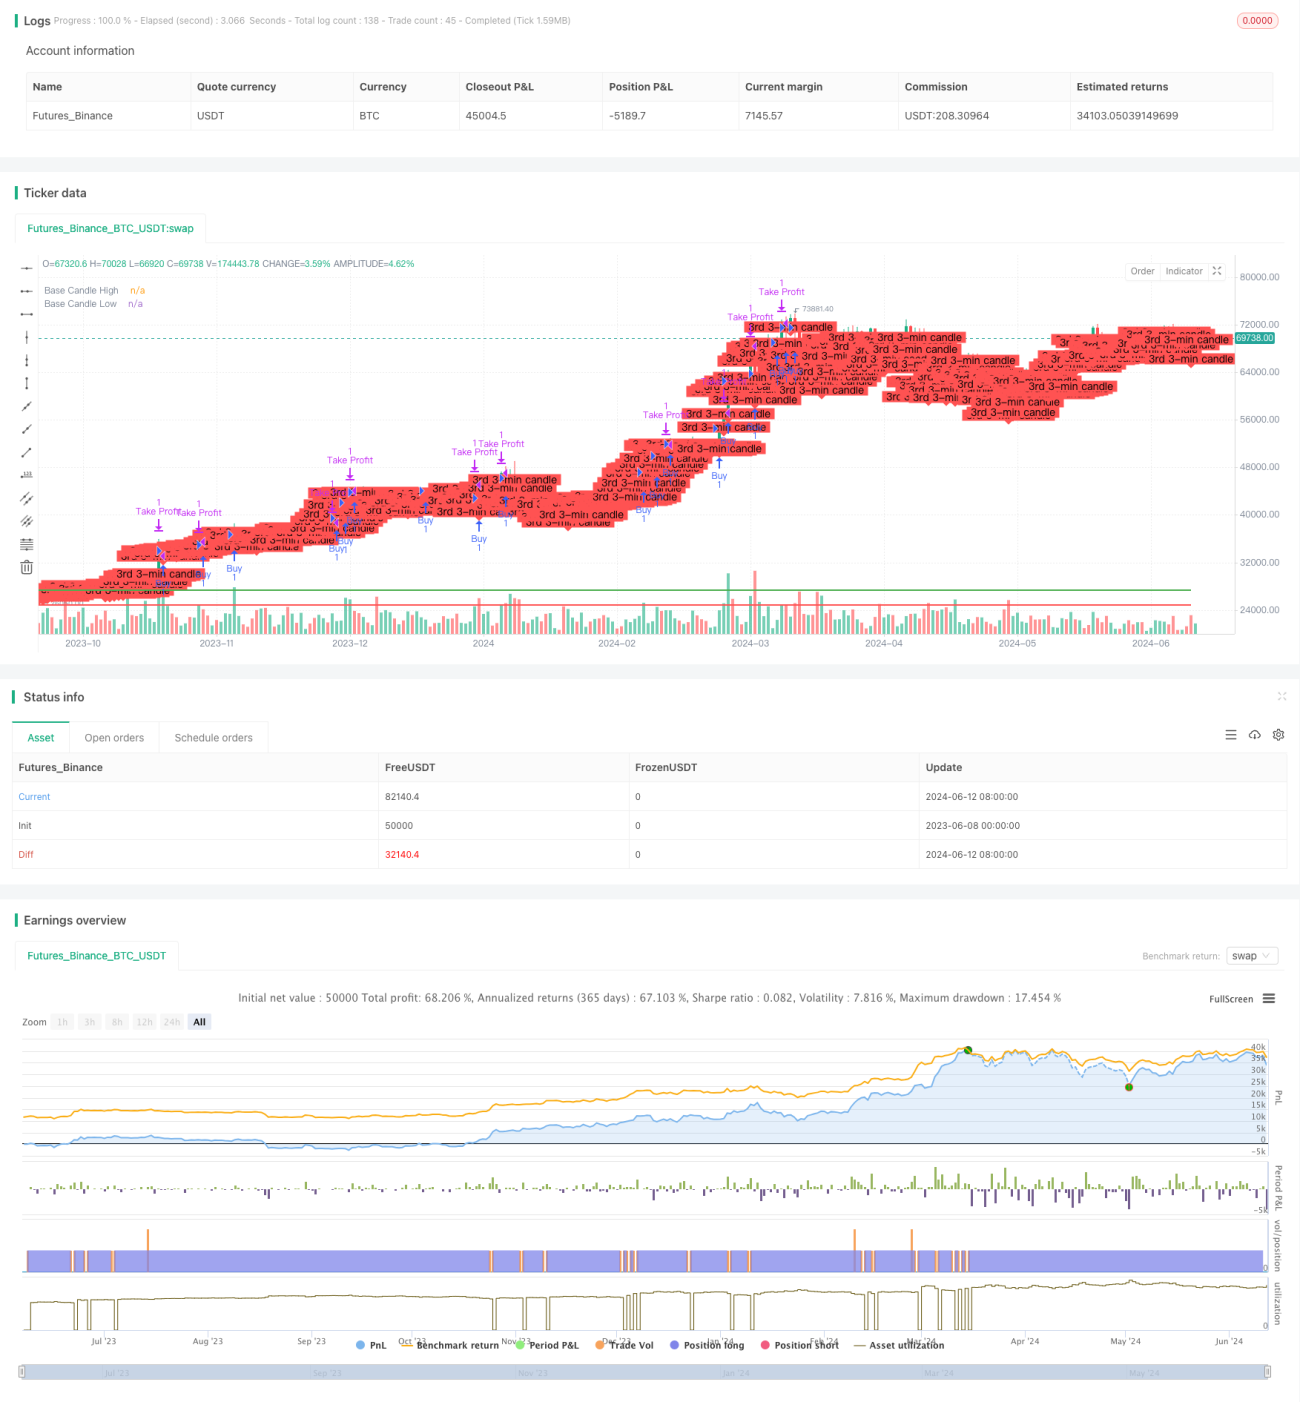
Gambaran keseluruhan
Strategi utama strategi ini adalah menggunakan titik tinggi dan rendah garis K tiga minit sebagai titik pecah, apabila harga menembusi titik tinggi garis K tiga minit, melakukan lebih banyak, ketika ia menembusi titik rendah. Strategi ini sesuai untuk perdagangan dalam hari, menutup posisi pada hari yang ditutup, dan meneruskan perdagangan pada hari berikutnya.
Prinsip Strategi
- Dapatkan data K-Line tiga minit pertama selepas pembukaan setiap hari dan rekodkan harga tertinggi dan terendah pada K-Line ketiga.
- Apabila harga menembusi harga tertinggi di K baris ketiga, buka lebih banyak pesanan, harga sasaran ditambah 100 mata pada harga pembukaan, sehingga ditutup atau mencapai harga sasaran.
- Apabila harga menembusi harga terendah garis K ketiga, buka pesanan kosong, dan harga sasaran dikurangkan 100 poin sebagai harga pembukaan, sehingga ditutup atau mencapai harga sasaran.
- Setiap hari, anda akan menutup dagangan anda dan teruskan dagangan anda pada hari berikutnya.
Kelebihan Strategik
- Mudah difahami, mudah dilaksanakan.
- Ia boleh digunakan untuk dagangan dalam sehari dan mempunyai kadar penggunaan dana yang tinggi.
- "Risiko yang agak rendah, titik hentian jelas.
- Berlaku untuk pasaran yang lebih trendy.
Risiko Strategik
- Apabila pasaran berubah-ubah, penarikan balik yang lebih besar mungkin berlaku.
- Harga saham akan turun dan turun dalam tempoh sesi terbuka.
- Ia juga boleh menyebabkan kesesatan dalam pengkajian.
Arah pengoptimuman strategi
- Anda boleh pertimbangkan untuk memasukkan penunjuk seperti purata bergerak untuk menapis isyarat bising di pasaran yang bergolak.
- Anda boleh pertimbangkan untuk mengoptimumkan masa untuk membuka kedudukan anda dan mengelakkan tempoh terbuka.
- Anda boleh mempertimbangkan untuk mengoptimumkan titik hentian hentian untuk meningkatkan kestabilan strategi.
- Anda boleh mempertimbangkan untuk menyertai pengurusan kedudukan untuk mengawal risiko pengeluaran.
ringkaskan
Strategi ini adalah berdasarkan tiga minit K garis tinggi rendah titik pecah, dan digunakan untuk perdagangan dalam hari. Kelebihannya adalah mudah difahami, mudah untuk melaksanakan, risiko yang agak rendah. Tetapi ada juga beberapa risiko, seperti apabila pasaran turun naik yang besar, mungkin akan berlaku pulangan besar.
Source
Pine
Strategy parameters
Related strategies
Comment
All comments (0)
No data
- 1