EMA100 dan NUPL strategi dagangan kuantitatif keuntungan tidak direalisasi relatif

Gambaran keseluruhan
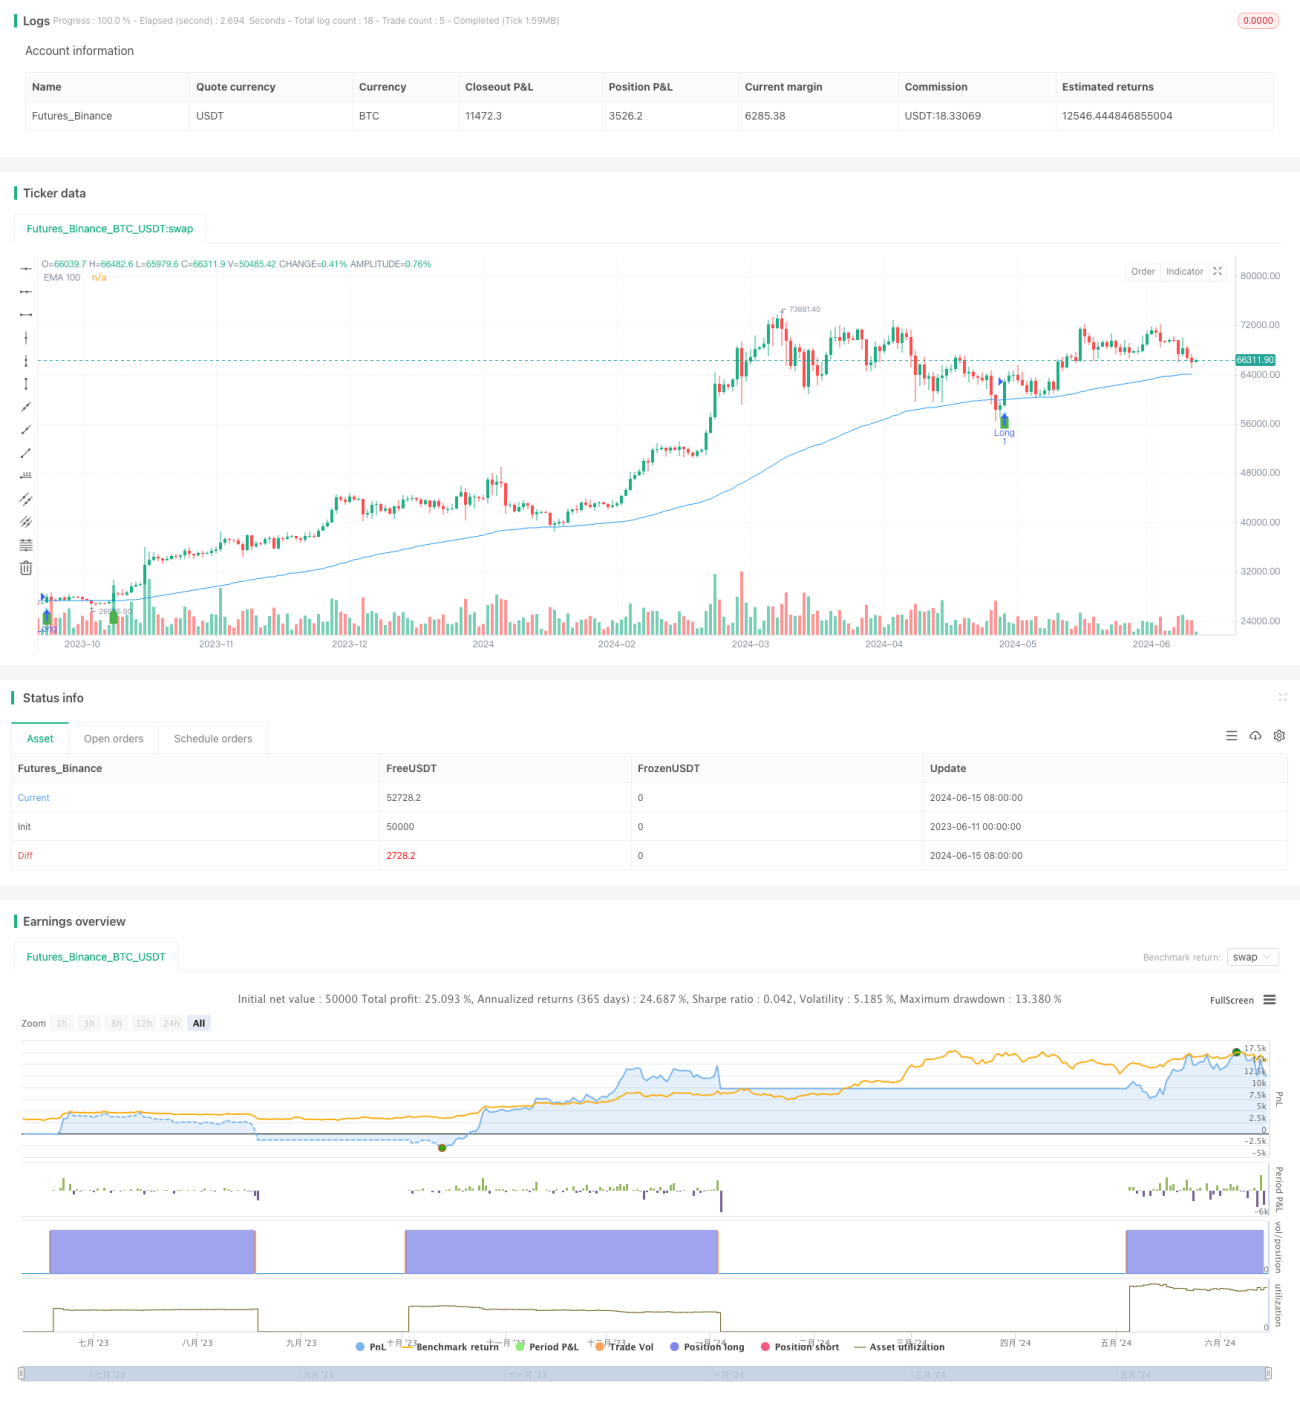
Strategi perdagangan ini berdasarkan 100 purata bergerak indeks kitaran ((EMA100), keuntungan / kerugian bersih yang belum dicapai ((NUPL) dan tiga petunjuk keuntungan yang belum dicapai, menghasilkan isyarat perdagangan dengan menilai persilangan harga dengan EMA100 dan negatif dari NUPL dan keuntungan yang belum dicapai. Isyarat berganda dicetuskan apabila harga melewati EMA100 di atas dan NUPL dan keuntungan yang belum dicapai secara positif; isyarat kosong dicetuskan apabila harga melewati EMA100 di bawah dan NUPL dan keuntungan yang belum dicapai secara negatif.
Prinsip Strategi
- Mengira 100 kitaran EMA sebagai penunjuk trend utama
- Menggunakan NUPL dan keuntungan yang tidak dicapai sebagai petunjuk tambahan untuk mengukuhkan kekuatan dan keberlanjutan trend
- Pada masa yang sama apabila harga melepasi / melepasi EMA100, NUPL dan keuntungan yang tidak dicapai secara relatif menghasilkan isyarat melakukan lebih banyak / lebih rendah untuk masa positif / negatif
- Menggunakan 10% kedudukan tetap, dan menetapkan 10% stop loss, mengawal risiko
- Apabila memegang kedudukan teratas, jika harga jatuh di bawah harga henti, kedudukan teratas akan dihapuskan; apabila memegang kedudukan kosong, jika harga jatuh di atas harga henti, kedudukan kosong akan dihapuskan
Analisis kelebihan
- Mudah difahami: Strategi ini logiknya jelas, menggunakan petunjuk teknikal yang biasa, mudah difahami dan dilaksanakan
- Pengesanan Trend: menangkap trend utama melalui EMA100, sesuai untuk digunakan dalam pasaran trend
- Kawalan risiko: Tetapkan kedudukan tetap dan berhenti untuk mengawal risiko dengan berkesan
- Kebolehan beradaptasi: Strategi ini boleh digunakan untuk pelbagai pasaran dan tanda dagangan
Analisis risiko
- Isyarat palsu: Dalam pasaran yang bergolak, harga yang sering bercampur dengan EMA100 mungkin menghasilkan lebih banyak isyarat palsu, yang menyebabkan kerugian
- Ketinggalan: EMA sebagai penunjuk ketinggalan, mungkin bertindak balas lambat ketika trend berbalik, kehilangan masa masuk yang terbaik
- Optimasi parameter: parameter strategi (seperti kitaran EMA, saiz kedudukan, peratusan stop loss) perlu dioptimumkan mengikut pasaran yang berbeza, parameter yang tidak sesuai boleh menyebabkan kesan strategi yang kurang baik
Arah pengoptimuman
- Pengoptimuman parameter: pengoptimuman parameter seperti kitaran EMA, saiz kedudukan, peratusan hentian untuk meningkatkan prestasi strategi
- Isyarat penapis: penapis isyarat palsu dengan penambahan petunjuk teknikal lain atau sentimen pasaran
- Pengurusan kedudukan dinamik: menyesuaikan kedudukan secara dinamik mengikut faktor seperti turun naik pasaran, keuntungan dan kerugian akaun, meningkatkan keuntungan dan mengawal risiko
- Portfolio pelbagai ruang: memegang kedudukan multi dan kosong, melindungi risiko pasaran, meningkatkan kestabilan strategi
ringkaskan
Strategi perdagangan ini menghasilkan isyarat perdagangan melalui EMA100, NUPL dan tiga indikator keuntungan yang tidak dicapai, dengan kelebihan seperti kejernihan logik, kawalan risiko, dan adaptasi yang kuat. Terdapat juga risiko seperti isyarat palsu, keterbelakangan dan pengoptimuman parameter. Strategi ini dapat dioptimumkan dan ditingkatkan pada masa depan melalui pengoptimuman parameter, penapisan isyarat, pengurusan kedudukan dinamik, dan kombinasi pelbagai ruang.
- 1