EMA Bullish Moving Average Crossover Strategy

1
Follow
1781
Followers
Gambaran keseluruhan
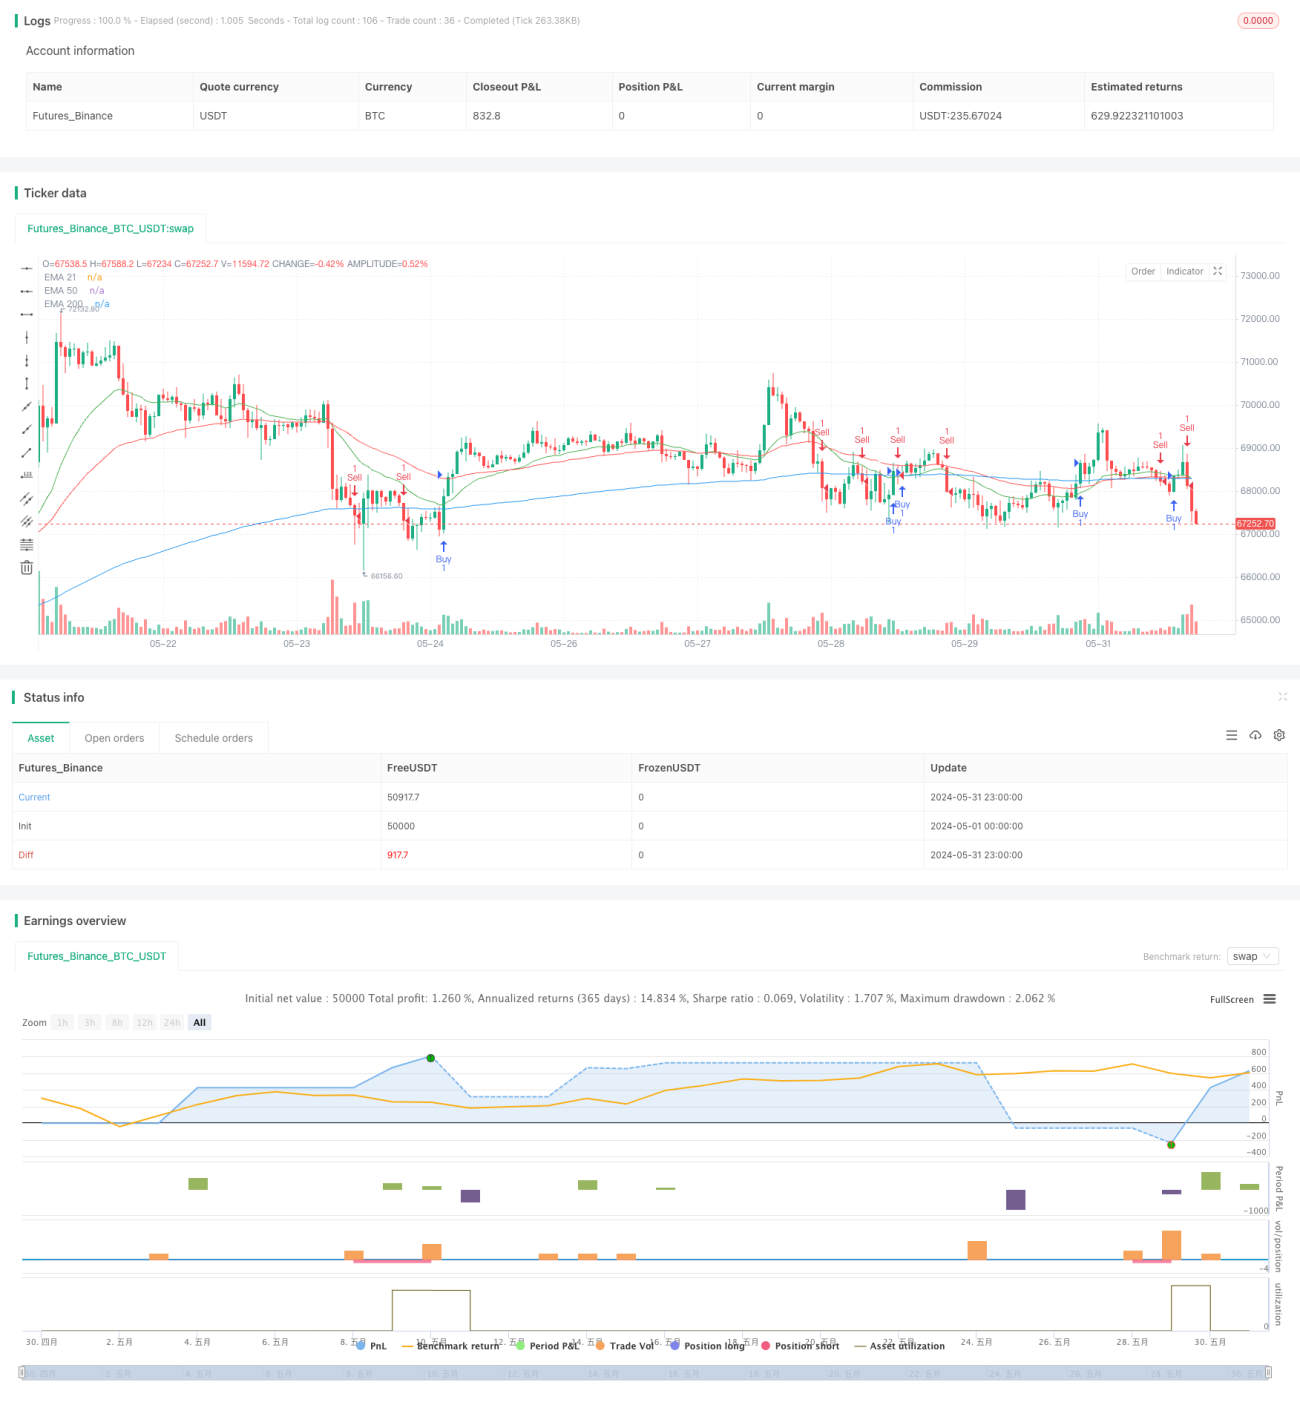
Strategi ini menggunakan indeks bergerak rata-rata ((EMA) dan indeks relatif lemah ((RSI) dari tiga kitaran yang berbeza untuk menilai trend pasaran dan isyarat perdagangan. Ia menghasilkan isyarat beli apabila harga menembusi 200 hari EMA dan RSI lebih besar daripada 50, sebaliknya ia menghasilkan isyarat jual apabila harga jatuh 200 hari EMA dan RSI kurang daripada 50.
Prinsip Strategi
- Hitung EMA 200 hari, 50 hari dan 21 hari, yang ditunjukkan dengan garis biru, merah dan hijau, masing-masing.
- Hitung RSI 14 kitaran.
- Apabila harga penutupan melepasi EMA 200 hari dan RSI lebih besar daripada 50, ia menghasilkan isyarat beli.
- Apabila harga penutupan melepasi EMA 200 hari dan RSI kurang daripada 50, ia menghasilkan isyarat menjual.
- Saiz kedudukan adalah 1% daripada nilai bersih akaun.
- Stop loss untuk pembelian adalah 50 mata di bawah EMA 200 hari, dan stop loss adalah 100 mata di atas harga pembelian.
- Kedudukan stop loss untuk menjual dagangan adalah 50 mata di atas EMA 200 hari, dan kedudukan stop loss adalah 100 mata di bawah harga jual.
Kelebihan Strategik
- Gabungan harga dan dinamika membantu menangkap masa trend terbentuk dan berbalik.
- Tiga kitaran EMA yang berbeza dapat mencerminkan trend jangka pendek dan panjang, mengurangkan frekuensi isyarat dan isyarat palsu.
- RSI boleh menyaring isyarat perdagangan di pasaran yang bergolak, mengurangkan kerugian perdagangan.
- Posisi peratusan tetap untuk mengawal risiko.
- Tetapkan penangguhan kerugian untuk mengelakkan risiko transaksi tunggal.
Risiko Strategik
- Penundaan isyarat pada titik perubahan trend mungkin menyebabkan sebahagian daripada keuntungan yang hilang.
- Isyarat RSI mungkin memberi isyarat pembalikan terlalu awal dalam trend yang kuat.
- Posisi peratusan tetap lebih berisiko dalam keadaan turun naik yang besar.
- Penutupan yang terlalu dekat dengan garis purata 200 hari boleh menyebabkan penutupan yang kerap.
Arah pengoptimuman strategi
- Masukkan lebih banyak kombinasi garis purata jangka panjang untuk mengoptimumkan isyarat.
- Untuk membetulkan isyarat, pertimbangkan jika RSI berpatah balik dan terlalu banyak membeli dan menjual.
- Saiz kedudukan disesuaikan secara dinamik mengikut indikator turun naik seperti ATR.
- Mengoptimumkan kedudukan hentian hentian, seperti berdasarkan tahap rintangan sokongan, peratusan atau ATR.
- Memperkenalkan syarat penapis trend, seperti ADX, untuk mengelakkan dagangan di pasaran yang bergolak.
- Pengoptimuman parameter dan pengesahan ulang untuk pelbagai standard dan kitaran.
ringkaskan
Strategi ini dapat menangkap keadaan trend jangka panjang dan sederhana yang agak jelas melalui tanda perdagangan EMA berlapis dan RSI yang kuat. Secara keseluruhan, ia sesuai untuk pasaran yang sedang berkembang. Ia boleh dioptimumkan dari segi isyarat, kedudukan, stop loss, penapis, dan lain-lain untuk meningkatkan kestabilan strategi dan nisbah risiko keuntungan.
Source
Pine
Related strategies
Comment
All comments (0)
No data
- 1