Strategi perdagangan kuantitatif menggabungkan EMA dan trend super

Gambaran keseluruhan
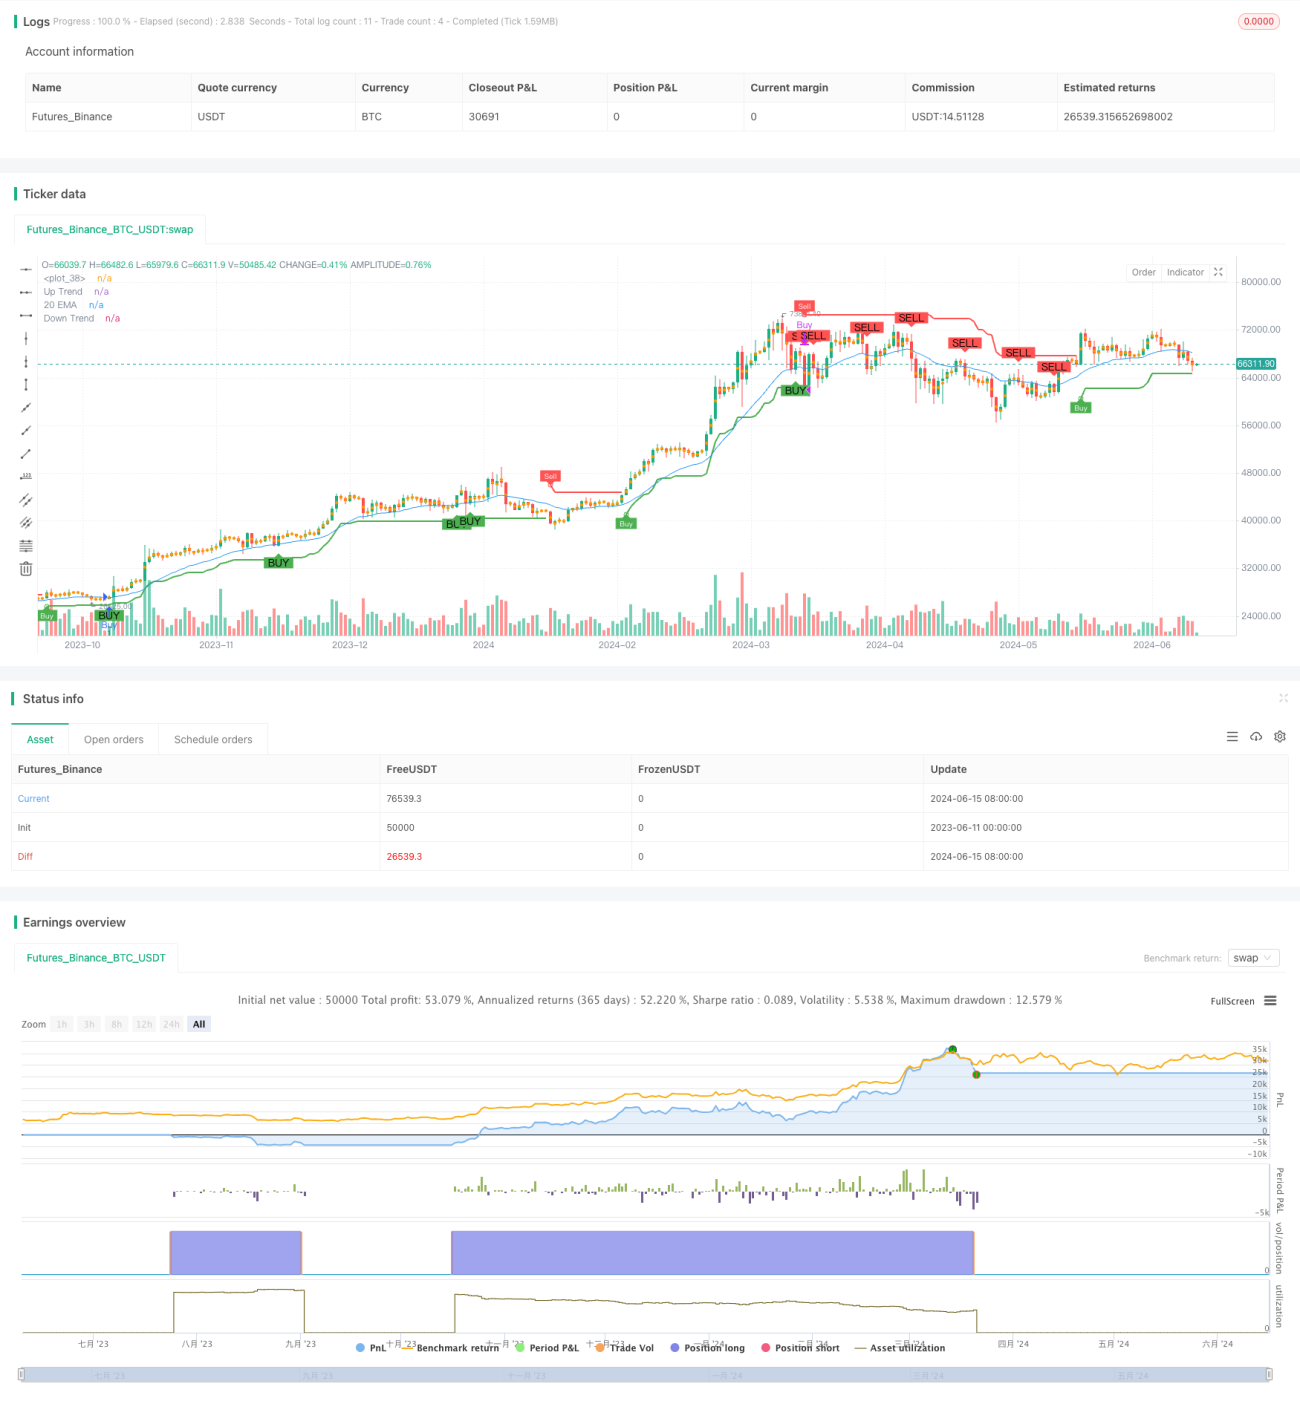
Strategi ini menggabungkan purata bergerak indeks (EMA) dan indikator super trend (Supertrend) untuk menghasilkan isyarat jual beli. Isyarat beli dihasilkan apabila harga menembusi 20 hari EMA dari atas dan indikator super trend berada dalam trend menurun. Isyarat jual dihasilkan apabila harga menembusi 20 hari EMA dari bawah dan indikator super trend berada dalam trend menurun.
Prinsip Strategi
- Hitung EMA 20 hari sebagai syarat penapisan untuk penilaian trend.
- Mengira indikator super trend, yang memetakan naik dan turun berdasarkan purata julat sebenar ((ATR) dan trend multirole.
- Sinyal beli dan jual dihasilkan berdasarkan arah trend dalam indikator supertrend dan kedudukan harga berbanding EMA 20 hari:
- Isyarat beli dihasilkan apabila harga menembusi 20 hari EMA dari atas dan indikator Super Trend berada dalam trend bullish.
- Sinyal jual dihasilkan apabila harga jatuh ke bawah EMA 20 hari dan indikator Super Trend berada dalam trend menurun.
- Strategi: buka lebih banyak kedudukan berdasarkan isyarat beli dan buka lebih sedikit berdasarkan isyarat jual.
Kelebihan Strategik
- Gabungan antara EMA dan Super Trend Indicator dapat menangkap trend secara berkesan dan mengurangkan isyarat palsu.
- Indikator Super Trend adalah berdasarkan ATR, yang dapat menyesuaikan jarak naik ke bawah secara dinamik untuk menyesuaikan diri dengan kadar turun naik pasaran yang berbeza.
- EMA berfungsi sebagai penyaring untuk menilai trend, memastikan bahawa anda membuka posisi di arah trend dan meningkatkan peluang strategi.
- Logik strategi mudah difahami dan dilaksanakan.
Risiko Strategik
- Dalam pasaran yang bergolak, strategi ini mungkin sering menghasilkan isyarat beli dan jual, menyebabkan terlalu banyak transaksi dan kehilangan bayaran.
- Strategi bergantung kepada EMA dan indikator supertrend, yang mungkin gagal atau terlewat dalam keadaan pasaran tertentu.
- Strategi ini tidak mempertimbangkan pengurusan risiko, seperti pengurusan hentian dan kedudukan, yang boleh menyebabkan penarikan balik yang lebih besar semasa turun naik pasaran yang kuat.
Arah pengoptimuman strategi
- Menggabungkan mekanisme hentian kerugian, seperti hentian dinamik yang ditetapkan mengikut ATR, untuk mengawal kerugian maksimum dalam satu transaksi.
- Mengoptimumkan parameter EMA dan indikator trend super, seperti menggunakan kaedah pengoptimuman parameter untuk mencari kombinasi parameter terbaik, meningkatkan kebolehpasaran dan kestabilan strategi.
- Memperkenalkan pengurusan kedudukan, menyesuaikan saiz kedudukan secara dinamik mengikut turun naik pasaran atau kerugian akaun, untuk mengawal risiko keseluruhan.
- Pertimbangkan untuk memasukkan syarat penapis lain, seperti jumlah transaksi, kadar turun naik, dan lain-lain, untuk mengurangkan isyarat palsu.
ringkaskan
Strategi ini menghasilkan isyarat jual beli dengan menggabungkan EMA 20 hari dan indikator super trend untuk menangkap tingkah laku trend. Kelebihan strategi ini adalah bahawa logiknya mudah, kombinasi EMA dan indikator super trend dapat mengurangkan isyarat palsu dengan berkesan. Tetapi dalam pasaran yang bergolak, strategi ini mungkin sering diperdagangkan dan kekurangan langkah-langkah pengurusan risiko.
- 1