Strategi Persilangan EMA Lanjutan: Sistem Perdagangan Adaptif Berdasarkan Sasaran Henti Kerugian dan Keuntungan Dinamik

Gambaran keseluruhan
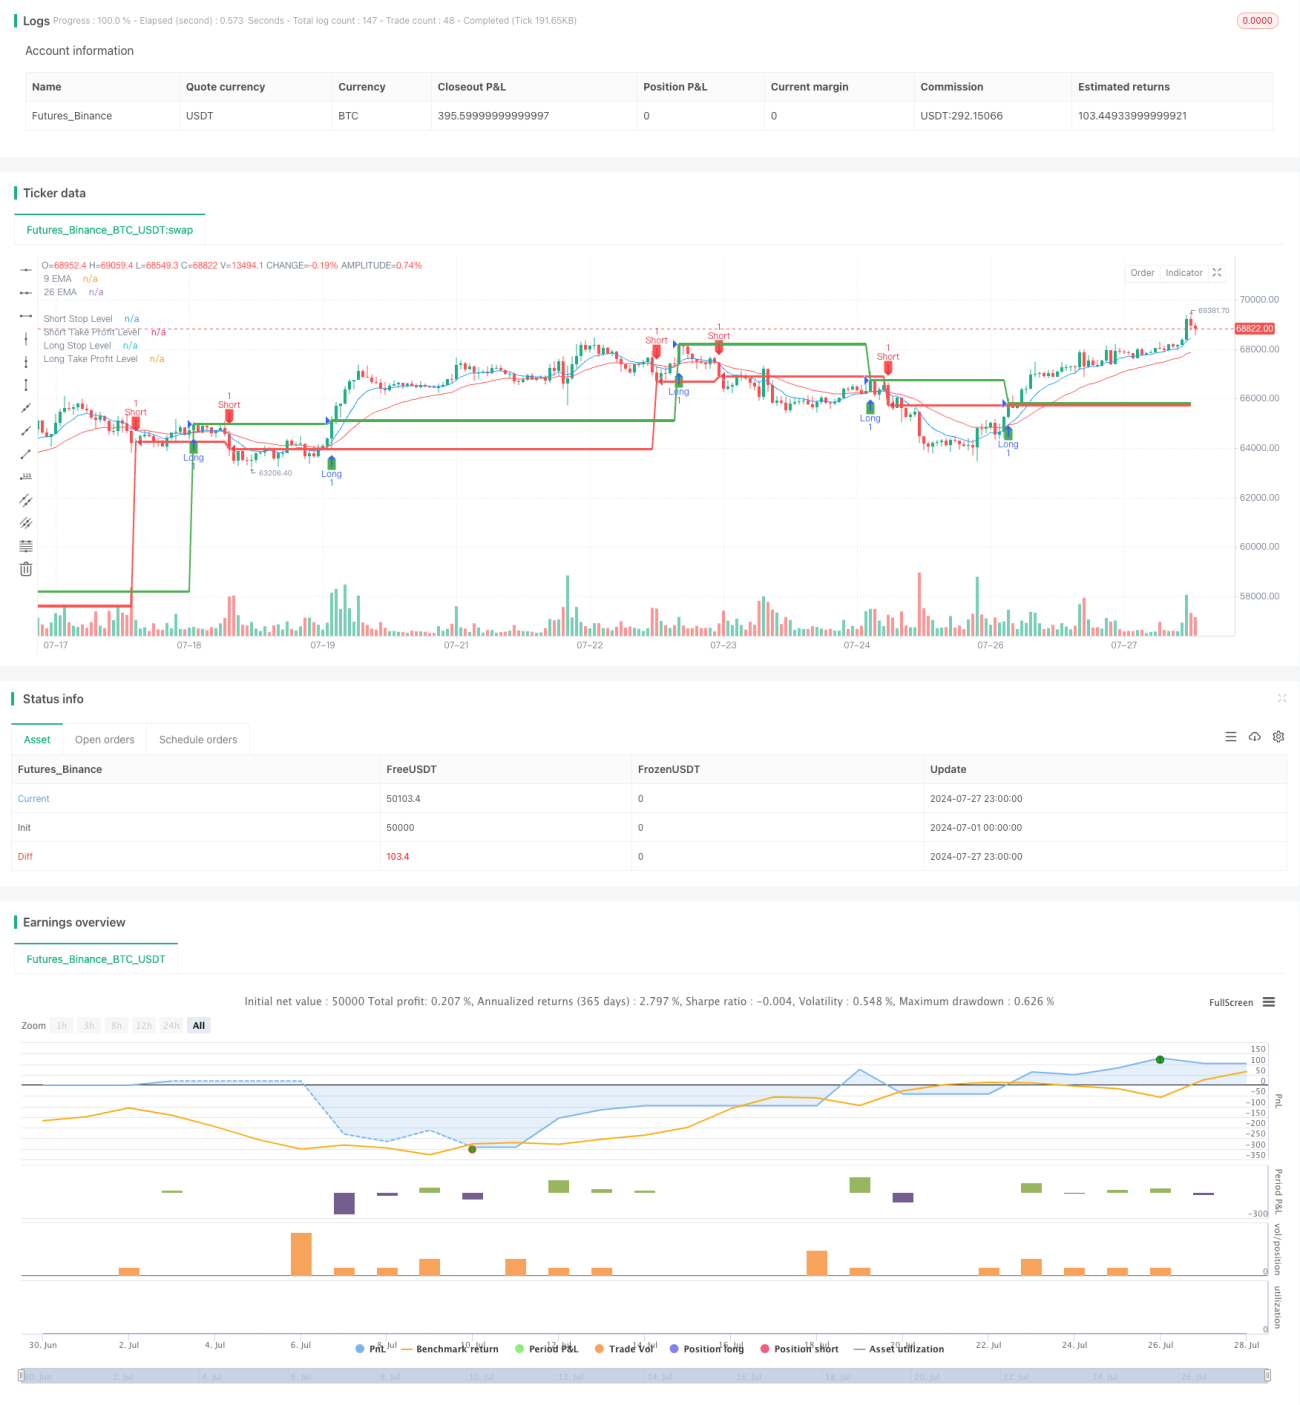
Strategi EMA Advanced Crossover ini adalah sistem perdagangan yang menyesuaikan diri yang menggunakan crossover rata-rata bergerak indeks (EMA) untuk menghasilkan isyarat perdagangan. Strategi ini menggabungkan EMA 9 dan 26 kitaran untuk mencetuskan isyarat beli dan jual apabila mereka berselisih. Strategi ini unik kerana ia memperkenalkan sasaran stop loss dan keuntungan yang tetap untuk menguruskan risiko dan mengunci keuntungan.
Prinsip Strategi
Di tengah-tengah strategi ini, dua EMA digunakan untuk menilai trend pasaran.
- Menggunakan EMA 9 kitaran dan 26 kitaran sebagai penunjuk utama.
- Apabila EMA 9 melintasi EMA 26 dari bawah, ia akan mencetuskan isyarat beli.
- Apabila 9 EMA dari atas melalui 26 EMA, ia akan mencetuskan isyarat menjual.
- Setiap dagangan mempunyai sasaran berhenti dan keuntungan yang tetap, yang dikira sebagai satuan tik.
- Stop loss untuk pembelian ditetapkan 90 tick di bawah harga masuk, dan sasaran keuntungan ditetapkan 270 tick di atas harga masuk.
- Stop loss untuk menjual set 90 tick di atas harga masuk, dan profit target set 270 tick di bawah harga masuk.
- Garis EMA, isyarat dagangan, dan tahap stop loss dan profit digambarkan pada carta untuk analisis intuitif.
- Tetapkan fungsi amaran untuk memaklumkan peniaga apabila berlaku persilangan EMA.
Kelebihan Strategik
- Pengesanan Trend: Menggunakan EMA untuk menangkap trend pasaran dan membantu perdagangan berselisih.
- Pengurusan risiko: matlamat berhenti dan keuntungan yang tetap membantu mengawal risiko dan potensi keuntungan setiap perdagangan.
- Visual: Memaparkan pelbagai isyarat dan tahap harga utama dengan jelas pada carta untuk memudahkan analisis dan membuat keputusan.
- Automasi: Strategi boleh melaksanakan transaksi secara automatik, mengurangkan campur tangan manusia dan kesan emosi.
- Fleksibiliti: Parameter EMA dan seting stop loss / profit boleh disesuaikan mengikut pasaran dan jangka masa yang berbeza.
- Amaran dalam masa nyata: membantu peniaga merebut peluang pasaran tepat pada masanya, meningkatkan kelajuan tindak balas.
Risiko Strategik
- Overtrading: Dalam pasaran yang bergolak, EMA mungkin sering bercampur, menyebabkan terlalu banyak isyarat palsu.
- Ketinggalan: EMA pada dasarnya adalah penunjuk ketinggalan, dan mungkin bertindak balas lebih lambat apabila trend berbalik.
- Penangguhan / keuntungan yang tetap: Dalam pasaran yang lebih tidak menentu, penangguhan tetap mungkin terlalu kecil dan matlamat keuntungan mungkin terlalu besar.
- Kurangnya pengiktirafan keadaan pasaran: strategi tidak mempertimbangkan keadaan pasaran keseluruhan dan mungkin berdagang dalam keadaan pasaran yang tidak sesuai.
- Kepercayaan kepada satu indikator: hanya bergantung kepada EMA cross mungkin mengabaikan maklumat pasaran penting yang lain.
Arah pengoptimuman strategi
- Matlamat Hentian Kerosakan dan Keuntungan Dinamis: Pertimbangkan untuk menggunakan ATR (Average True Range) untuk menyesuaikan tahap Hentian Kerosakan dan Keuntungan secara dinamik untuk menyesuaikan diri dengan turun naik pasaran.
- Menambah syarat penapisan: memperkenalkan petunjuk teknikal lain (seperti RSI atau MACD) sebagai isyarat pengesahan, mengurangkan pecah palsu.
- Pengiktirafan keadaan pasaran: penambahan penunjuk kekuatan trend ((seperti ADX), untuk melakukan perdagangan hanya dalam pasaran trend yang kuat.
- Analisis jangka masa berbilang: menggabungkan jangka masa yang lebih lama untuk mengesahkan arah trend keseluruhan.
- Pengurusan Posisi: Menerapkan fungsi penangguhan dan penambahan saham untuk mengoptimumkan pengurusan dana.
- Pemantauan dan pengoptimuman: Pemantauan menyeluruh terhadap kombinasi parameter yang berbeza untuk mencari tetapan optimum.
- Meningkatkan penapisan jumlah dagangan: mengelakkan dagangan pada masa jumlah dagangan yang rendah, mengurangkan risiko slippage dan penembusan palsu.
ringkaskan
Strategi penyambung EMA lanjutan ini menyediakan kerangka kerja yang mudah dan berkesan untuk menangkap trend pasaran dan menguruskan risiko. Dengan menggabungkan isyarat penyambung EMA, parameter pengurusan risiko tetap dan amaran masa nyata, strategi ini menyediakan pedagang dengan sistem perdagangan yang komprehensif. Walau bagaimanapun, untuk mendapatkan kesan yang lebih baik dalam perdagangan sebenar, lebih banyak pengoptimuman dan ujian disyorkan.
- 1