1
fokus pada
1750
Pengikut
Gambaran keseluruhan
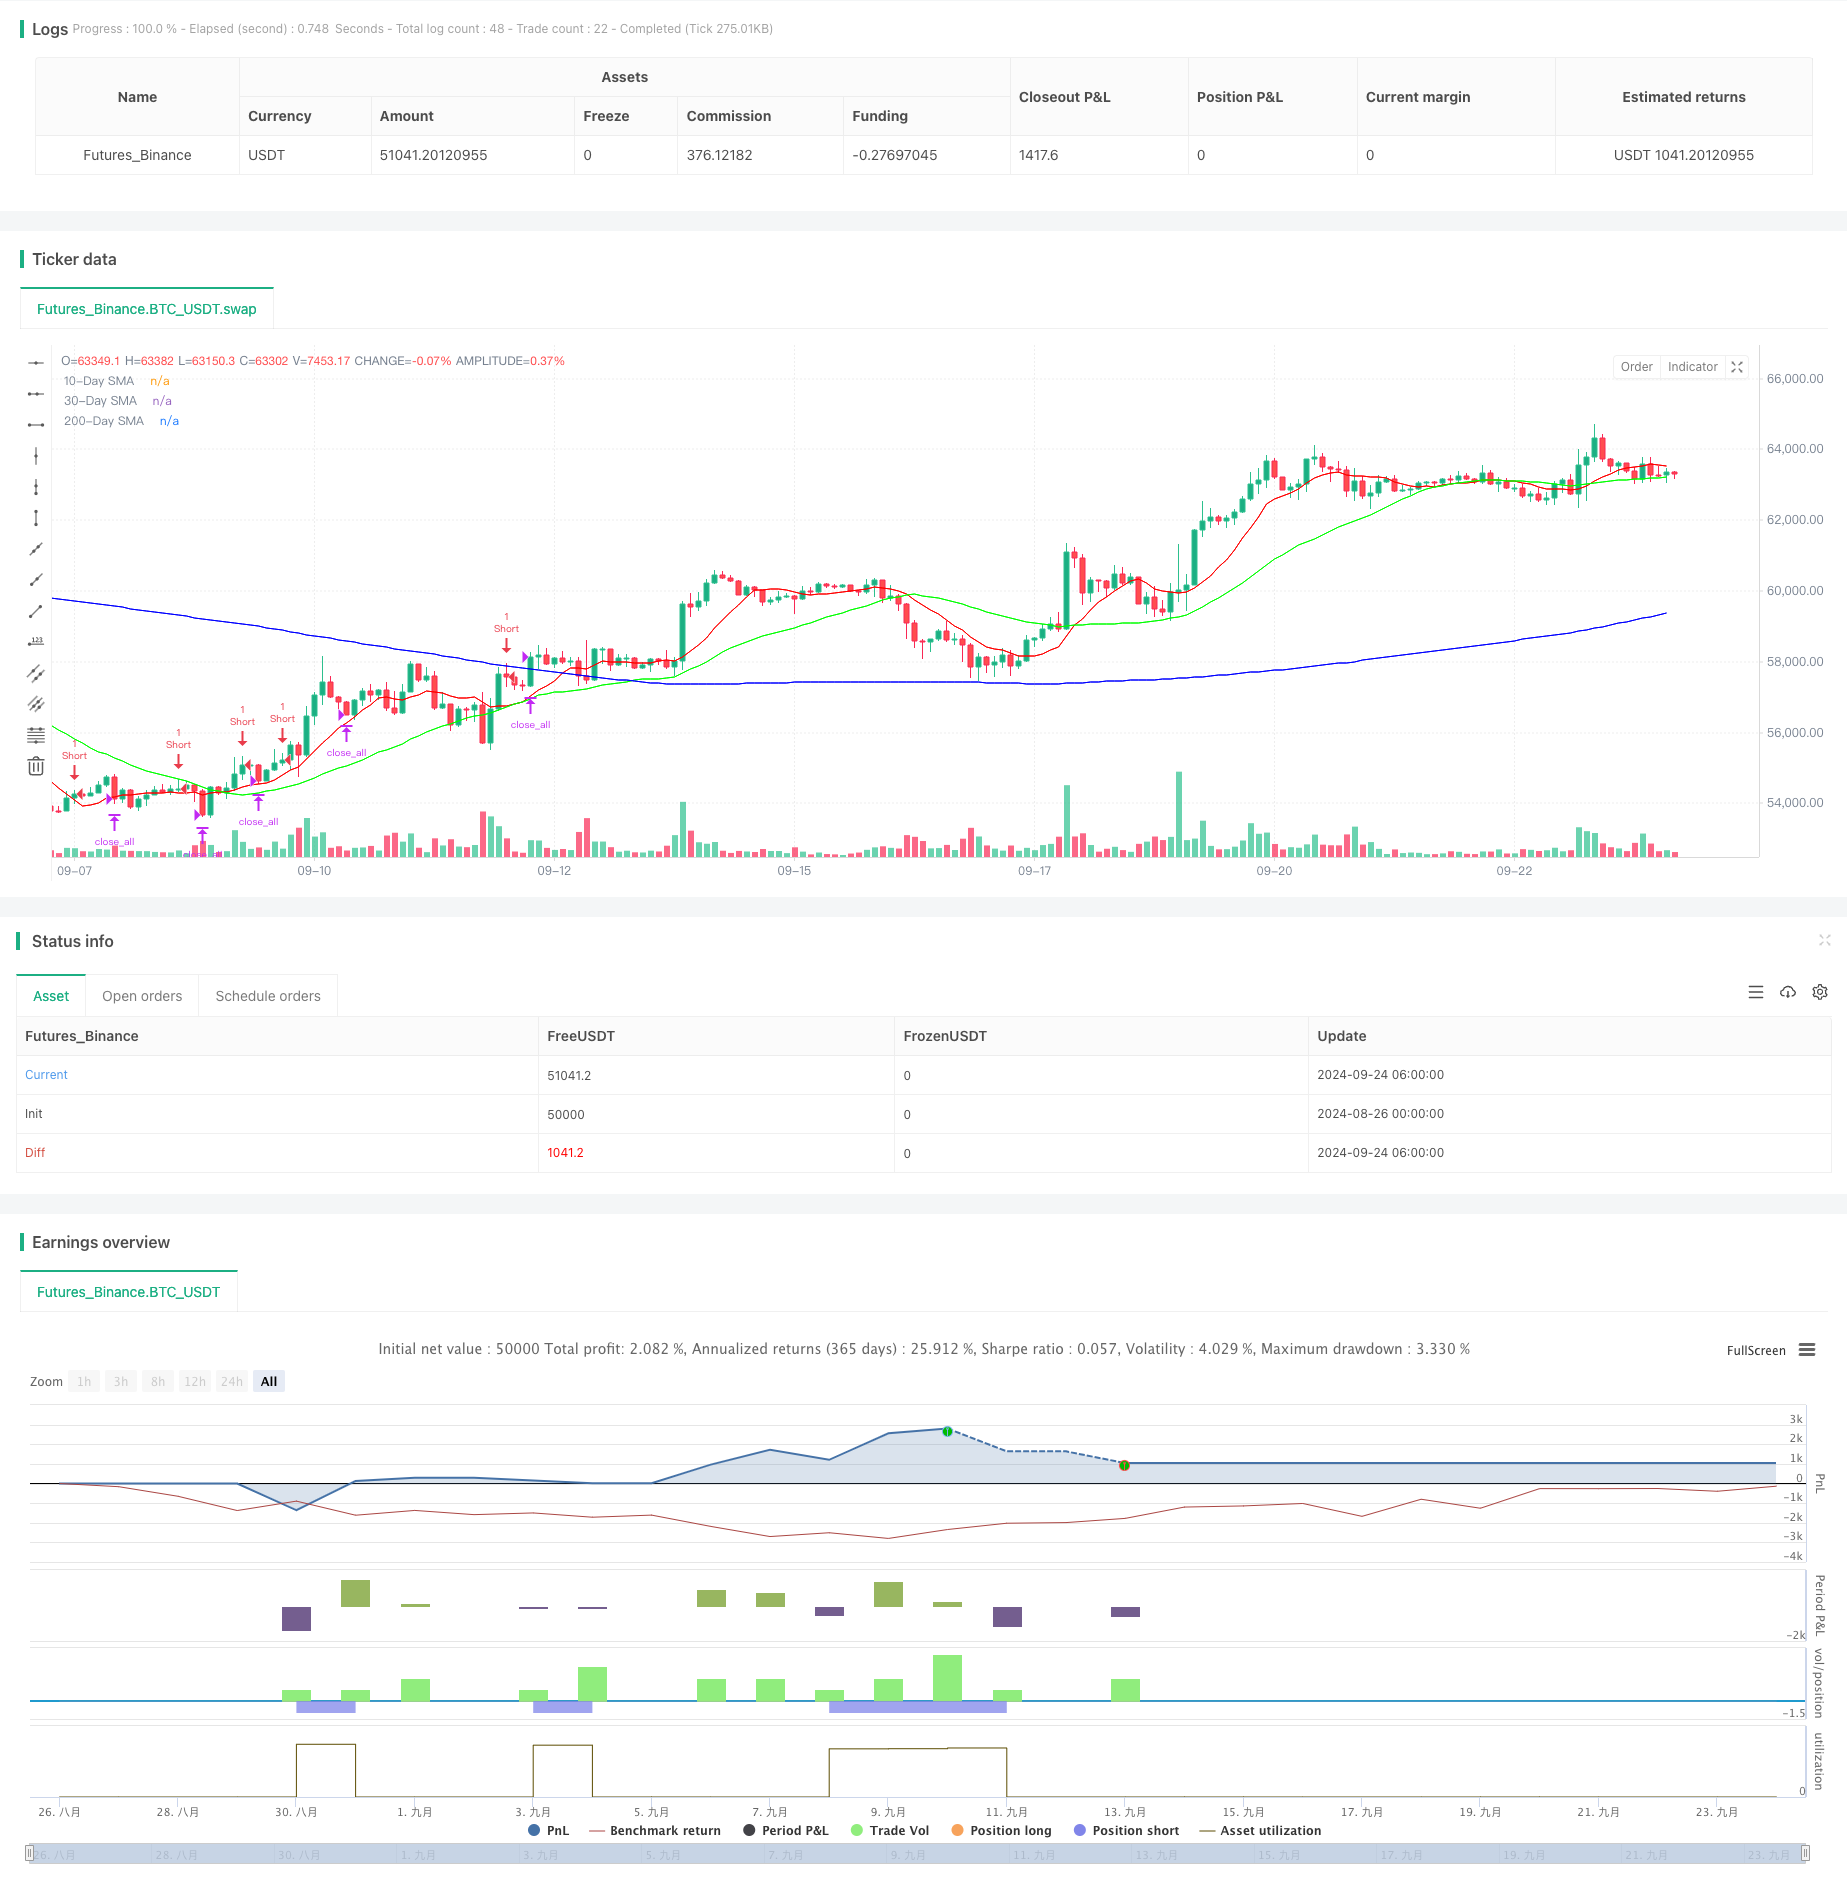
Strategi overbought RSI adalah strategi perdagangan garis pendek yang menggabungkan indikator teknikal dan pengurusan kedudukan dinamik. Strategi ini menggunakan indikator yang agak kuat (RSI) dan purata bergerak sederhana (SMA) untuk mengenal pasti potensi keadaan overbought dan peluang reversal, dan untuk mengoptimumkan nisbah keuntungan risiko dengan cara membina kedudukan secara berturut-turut.
Prinsip Strategi
Strategi ini terdiri daripada beberapa langkah utama:
- Penghakiman trend jangka panjang: menggunakan purata bergerak mudah 200 hari ((SMA) sebagai penapis trend jangka panjang. Strategi hanya akan mempertimbangkan peluang shorting apabila harga berada di bawah SMA 200 hari.
- Pengenalan keadaan overbought: menggunakan penunjuk RSI 2 kitaran lebih tinggi daripada 75 selama dua hari berturut-turut untuk menilai keadaan overbought jangka pendek.
- Pembinaan perbendaharaan secara berturut-turut: pembinaan perbendaharaan awal sebanyak 10% dan kemudian meningkat secara beransur-ansur mengikut pergerakan harga. Apabila harga lebih tinggi daripada harga pembinaan perbendaharaan terakhir, peningkatan perbendaharaan masing-masing sebanyak 20%, 30% dan 40%
- Syarat keluar: Apabila RSI 2 kitaran lebih rendah daripada 30 (menunjukkan kemungkinan oversold) atau 30 hari SMA di atas SMA 10 (menunjukkan kemungkinan pembalikan trend), semua kedudukan akan dipadamkan.
Kelebihan Strategik
- Kawalan risiko: Kawalan risiko yang berkesan dalam perdagangan tunggal melalui pembinaan dan pengurusan kedudukan yang dinamik.
- Pengesanan Trend: Menggunakan gabungan purata bergerak jangka panjang untuk menangkap trend jangka panjang dan mengenal pasti peluang pembalikan jangka pendek.
- Fleksibiliti: Parameter strategi boleh disesuaikan dengan keadaan pasaran yang berbeza dan jenis perdagangan, dan sangat mudah disesuaikan.
- Automasi pelaksanaan: Strategi logik yang jelas dan mudah untuk memprogramkan perdagangan automatik.
Risiko Strategik
- Risiko pasaran: risiko kerugian berterusan dalam keadaan kenaikan harga yang kuat.
- Risiko terlalu banyak penambahan: mekanisme penambahan kumpulan mungkin menyebabkan pendedahan berlebihan kepada pasaran di bawah isyarat yang salah.
- Risiko kecairan: Dalam pasaran yang kurang kecairan, perdagangan besar boleh menyebabkan peningkatan slippage.
- Kekurangan indikator teknikal: Indikator teknikal seperti RSI dan SMA boleh menghasilkan isyarat palsu yang menyebabkan keputusan perdagangan yang salah.
Arah pengoptimuman strategi
- Memperkenalkan penunjuk kadar turun naik: gabungan penunjuk kadar turun naik seperti ATR ((rata-rata gelombang sebenar), penyesuaian dinamik untuk membina kedudukan dan nilai terhad kedudukan.
- Optimumkan logik peleburan: boleh mempertimbangkan untuk menyesuaikan kadar peleburan secara dinamik mengikut tahap turun naik pasaran, untuk mengelakkan peleburan berlebihan pada masa turun naik yang tinggi.
- Menambah penapisan asas: menggabungkan faktor asas seperti petunjuk sentimen pasaran atau data ekonomi makro untuk meningkatkan kebolehpercayaan isyarat masuk.
- Pengoptimuman Retrospektif: Mengoptimumkan tetapan parameter, meningkatkan kestabilan dan keuntungan strategi melalui pengesanan data sejarah yang banyak.
ringkaskan
Strategi berpatah balik overbought RSI adalah strategi perdagangan garis pendek yang menggabungkan analisis teknikal dan pengurusan risiko. Strategi ini bertujuan untuk menangkap peluang berpatah balik yang berpotensi di pasaran dengan menggunakan isyarat overbought RSI dan penilaian trend SMA.
Kod sumber strategi
/*backtest
start: 2024-08-26 00:00:00
end: 2024-09-24 08:00:00
period: 2h
basePeriod: 2h
exchanges: [{"eid":"Futures_Binance","currency":"BTC_USDT"}]
*/

//@version=5
strategy("TPS Short Strategy by Larry Conners", overlay=true)

// Define parameters as inputs
sma_length_200 = input.int(200, title="200-Day SMA Length")
rsi_length_2 = input.int(2, title="2-Period RSI Length")
sma_length_10 = input.int(10, title="10-Day SMA Length")
sma_length_30 = input.int(30, title="30-Day SMA Length")

// Define colors as RGB values
color_sma_200 = input.color(color.rgb(0, 0, 255), title="200-Day SMA Color") // Blue
color_sma_10 = input.color(color.rgb(255, 0, 0), title="10-Day SMA Color") // Red
color_sma_30 = input.color(color.rgb(0, 255, 0), title="30-Day SMA Color") // Green

// Calculate indicators
sma_200 = ta.sma(close, sma_length_200)
rsi_2 = ta.rsi(close, rsi_length_2)
sma_10 = ta.sma(close, sma_length_10)
sma_30 = ta.sma(close, sma_length_30)

// Define conditions
below_sma_200 = close < sma_200
rsi_2_above_75_two_days = rsi_2[1] > 75 and rsi_2 > 75
price_higher_than_entry = na(strategy.opentrades.entry_price(0)) ? false : close > strategy.opentrades.entry_price(0)

// Entry conditions
if (below_sma_200 and rsi_2_above_75_two_days and na(strategy.opentrades.entry_price(0)))
    strategy.entry("Short", strategy.short, qty=1) // Short 10% of the position

// Scaling in conditions
if (price_higher_than_entry)
    strategy.entry("Short2", strategy.short, qty=2) // Short 20% more of the position

if (price_higher_than_entry)
    strategy.entry("Short3", strategy.short, qty=3) // Short 30% more of the position

if (price_higher_than_entry)
    strategy.entry("Short4", strategy.short, qty=4) // Short 40% more of the position

// Exit conditions
exit_condition_rsi_below_30 = rsi_2 < 30
exit_condition_sma_cross = ta.crossover(sma_10, sma_30)

if (exit_condition_rsi_below_30 or exit_condition_sma_cross)
    strategy.close_all() // Close all positions

// Plot indicators
plot(sma_200, color=color_sma_200, title="200-Day SMA")
plot(sma_10, color=color_sma_10, title="10-Day SMA")
plot(sma_30, color=color_sma_30, title="30-Day SMA")