Momentum RSI berbilang tempoh dan Trend EMA Tigaan Mengikuti Strategi Komposit

Gambaran keseluruhan
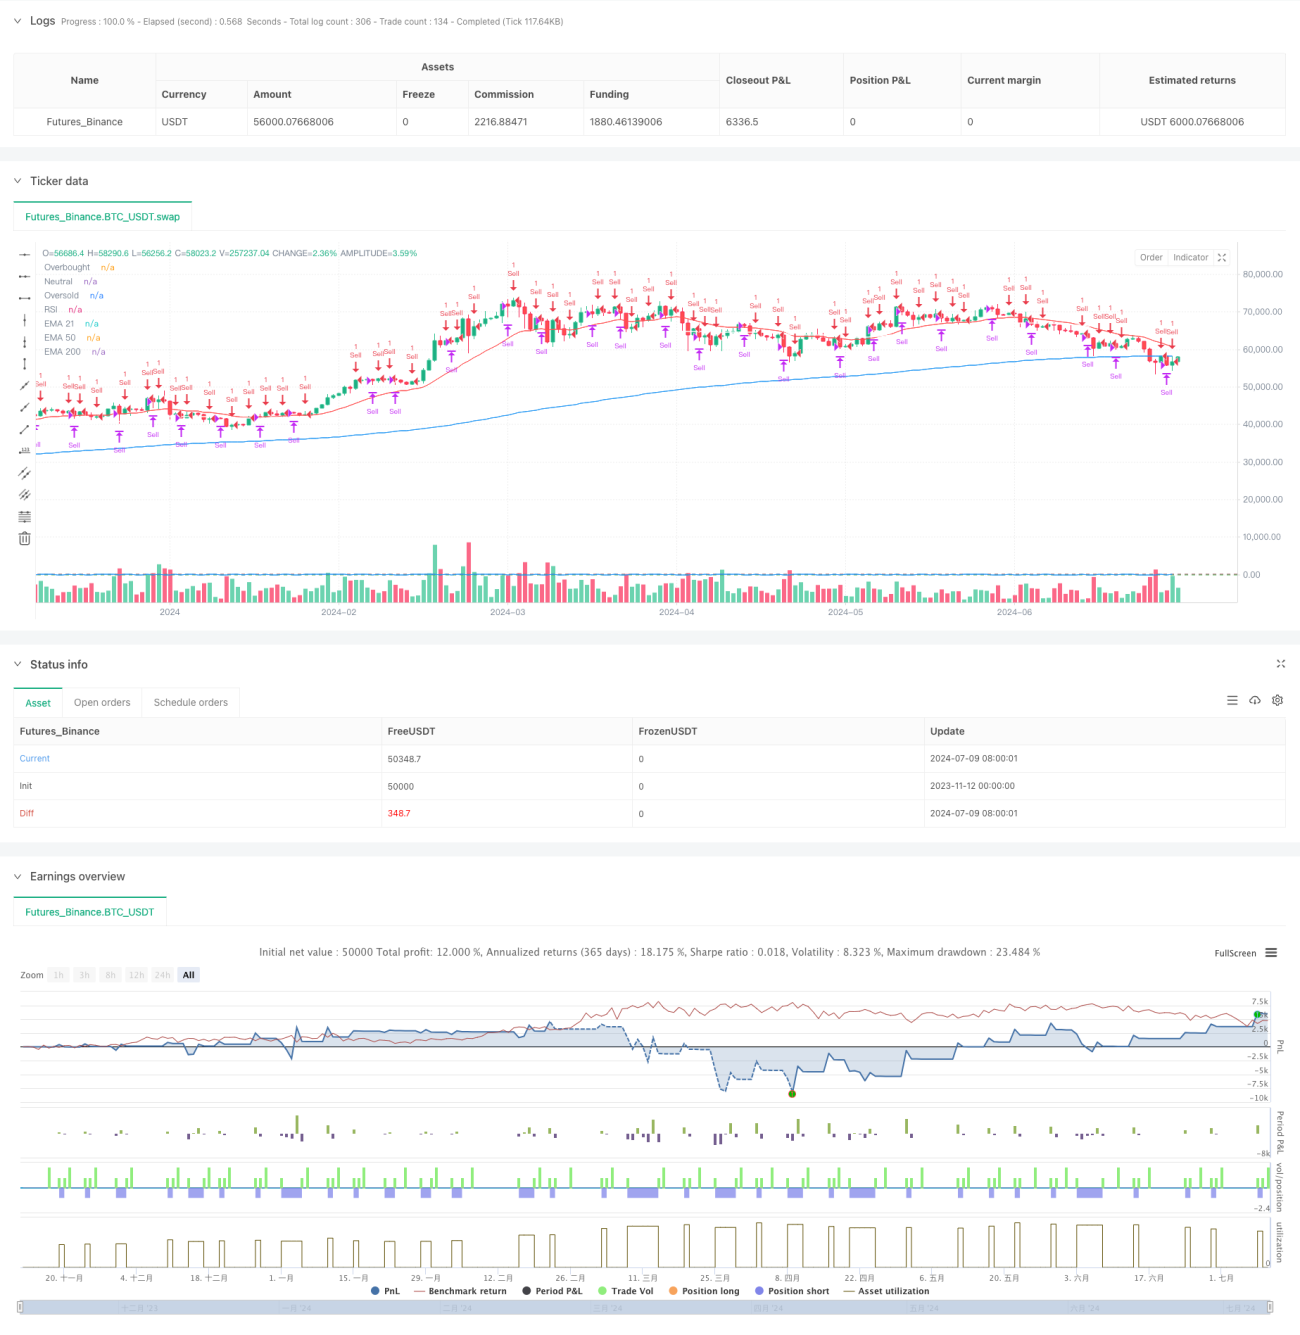
Strategi ini adalah sistem perdagangan komposit yang menggabungkan penunjuk momentum RSI dan penunjuk trend EMA. Ia berjalan pada dua kitaran masa 1 minit dan 5 minit, membuat keputusan perdagangan melalui isyarat overbought dan oversold RSI dan penghakiman trend EMA tiga. Strategi ini merangkumi ciri-ciri pengesanan trend dan pengembalian nilai rata-rata, yang dapat menangkap peluang perdagangan dalam keadaan pasaran yang berbeza.
Prinsip Strategi
Strategi menggunakan EMA triple 21/50/200 hari sebagai penanda aras trend, dan digabungkan dengan RSI versi yang diperbaharui (dihitung dengan kaedah Chebyshev) untuk mengenal pasti keadaan pasaran yang lebih baik daripada yang lebih baik. Pada kitaran 1 minit, apabila RSI menembusi 94, buka shorting, jatuh pada kedudukan yang sama pada 4, dan menetapkan hentian jaminan ketika RSI kembali ke 50. Pada kitaran 5 minit, apabila harga menembusi EMA 200 hari dan bangkit kembali, buka lebih banyak, dan menetap pada masa RSI melebihi atau jatuh. Strategi untuk mengelakkan berulang masuk ke dalam pasaran melalui pembolehubah pengurusan kedudukan inLongPosition dan inPositionShort.
Kelebihan Strategik
- Analisis pelbagai kitaran masa meningkatkan kebolehpercayaan isyarat
- Kaedah ini boleh digunakan untuk mengkaji trend dan dinamika.
- Mempunyai mekanisme penangguhan kerugian dan kawalan risiko
- Dengan menggunakan kaedah pengiraan RSI yang lebih baik, isyarat lebih tepat
- Mengelakkan transaksi berulang melalui pengurusan kedudukan
- Keupayaan untuk menyesuaikan diri dengan keadaan pasaran yang berbeza
Risiko Strategik
- Transaksi yang kerap boleh menyebabkan bayaran yang lebih tinggi
- Kemungkinan sering mencetuskan hentian dalam pasaran yang bergolak
- Indeks RSI mungkin menghasilkan isyarat palsu dalam keadaan pasaran tertentu
- Strategi berbilang kitaran mungkin terlewat dalam pengesahan isyarat
- Sinyal silang EMA mungkin mengelirukan pasaran yang bergolak
Arah pengoptimuman strategi
- Memperkenalkan penapis kadar lonjakan untuk menyesuaikan parameter semasa lonjakan tinggi
- Meningkatkan mekanisme pengesahan jumlah transaksi
- Mengoptimumkan RSI, pertimbangan untuk perubahan dinamik
- Tambah lebih banyak petunjuk teknikal untuk disahkan silang
- Memperkenalkan mekanisme parameter penyesuaian
- Membangunkan mekanisme penangguhan kerugian yang lebih halus
ringkaskan
Strategi ini meningkatkan kestabilan dan kebolehpercayaan dagangan dengan menggabungkan beberapa petunjuk teknikal dan analisis kitaran masa berganda. Walaupun terdapat risiko tertentu, risiko dapat dikawal dengan berkesan melalui pengurusan kedudukan yang munasabah dan mekanisme hentikan kerugian.
- 1