
Gambaran keseluruhan
Strategi ini adalah sistem perdagangan kuantitatif yang menggabungkan Bollinger Bands, indikator RSI yang agak kuat, dan purata kos dinamik. Strategi ini menggunakan peraturan pengurusan dana untuk melaksanakan operasi pembentukan gudang secara automatik dalam pergerakan pasaran, sambil menggabungkan petunjuk teknikal untuk membuat keputusan tentang isyarat jual beli, untuk melaksanakan perdagangan yang dapat dikawal risiko. Sistem ini juga mengandungi logik hentian dan fungsi penjejakan keuntungan kumulatif, yang dapat memantau dan menguruskan prestasi perdagangan dengan berkesan.
Prinsip Strategi
Strategi ini terutamanya berdasarkan komponen teras berikut:
- Indeks Brin-Band digunakan untuk menilai pergerakan harga, mempertimbangkan untuk membeli apabila harga menyentuh rel bawah dan menjual apabila ia menyentuh rel atas
- RSI digunakan untuk mengesahkan keadaan pasaran overbought dan oversold, RSI di bawah 25 mengesahkan oversold, di atas 75 mengesahkan oversold
- Modul DCA menganggarkan jumlah setiap penempatan berdasarkan dinamika hak dan kepentingan akaun, mewujudkan pengurusan dana yang sesuai
- Modul Stop-loss menetapkan sasaran keuntungan 5% untuk mencapai sasaran perlindungan keuntungan automatik
- Modul pemantauan keadaan pasaran mengira perubahan pasaran selama 90 hari untuk membantu menentukan trend keseluruhan
- Modul pengesanan keuntungan terkumpul mencatat keuntungan dan kerugian setiap perdagangan untuk menilai prestasi strategi
Kelebihan Strategik
- Meningkatkan kebolehpercayaan isyarat dengan menggunakan cross-validasi pelbagai petunjuk teknikal
- Menggunakan pengurusan kedudukan dinamik untuk mengelakkan risiko dari kedudukan tetap
- Menetapkan syarat-syarat penangguhan yang munasabah untuk mengunci keuntungan
- Fungsi Pemantauan Trend Pasaran Untuk Memahami Keadaan
- Sistem pemantauan keuntungan yang baik untuk menganalisis prestasi strategi
- Fungsi amaran yang sempurna untuk memberi amaran kepada peluang perdagangan dalam masa nyata
Risiko Strategik
- Pasaran yang bergolak mungkin sering mencetuskan isyarat yang menyebabkan kos dagangan meningkat
- Indeks RSI mungkin ketinggalan dalam pasaran trend
- Penangguhan peratusan tetap mungkin keluar terlalu awal dalam pasaran yang kuat
- Strategi DCA dalam pasaran yang jatuh secara sepihak mungkin menyebabkan pengunduran yang lebih besar
Langkah-langkah berikut disyorkan untuk menguruskan risiko:
- Tetapkan had pegangan maksimum
- Parameter penyesuaian dinamik mengikut turun naik pasaran
- Tambah penapis trend
- Menerapkan strategi penangguhan bertingkat
Arah pengoptimuman strategi
- Pengoptimuman dinamik parameter:
- Parameter Brin boleh disesuaikan mengikut kadar turun naik
- RSI terhad boleh berubah mengikut kitaran pasaran
- Peratusan dana DCA boleh disesuaikan dengan saiz akaun
- Sistem isyarat dipertingkat:
- Tingkatkan pengesahan volum
- Menambah analisis garisan trend
- Menerusi lebih banyak penanda aras teknikal
- Pengendalian risiko:
- Mencapai Hentikan Kerosakan Dinamik
- Tambah kawalan penarikan maksimum
- Tetapkan had kerugian harian
ringkaskan
Strategi ini membina sistem perdagangan yang lebih lengkap dengan menggunakan analisis teknikal dan kaedah pengurusan wang secara komprehensif. Keunggulan strategi adalah pengiktirafan pelbagai isyarat dan pengurusan risiko yang baik, tetapi masih memerlukan ujian dan pengoptimuman yang mencukupi di lapangan. Dengan terus memperbaiki parameter dan menambah indikator tambahan, strategi ini dijangka dapat mencapai prestasi yang stabil dalam perdagangan sebenar.
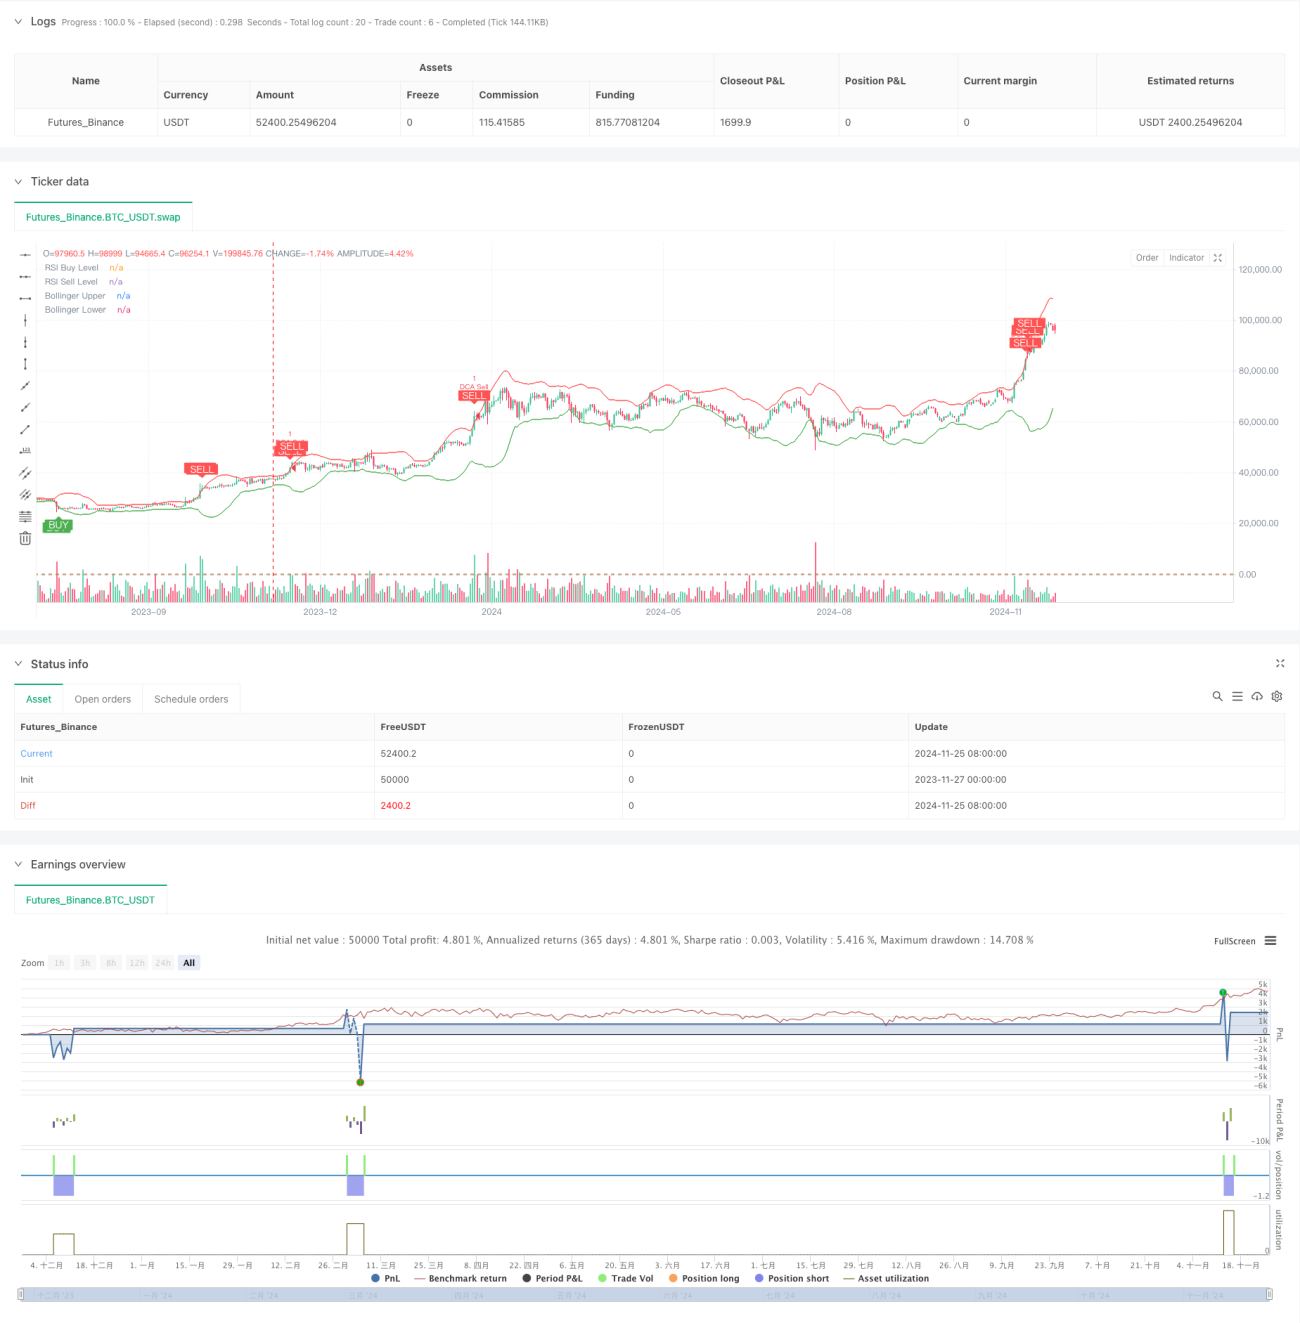
/*backtest
start: 2023-11-27 00:00:00
end: 2024-11-26 00:00:00
period: 1d
basePeriod: 1d
exchanges: [{"eid":"Futures_Binance","currency":"BTC_USDT"}]
*/

//@version=5
strategy("Combined BB RSI with Cumulative Profit, Market Change, and Futures Strategy (DCA)", shorttitle="BB RSI Combined DCA Strategy", overlay=true)

// Input Parameters- 1