Penjejakan arah aliran berbilang tempoh dan strategi pengurusan turun naik ATR

Gambaran keseluruhan
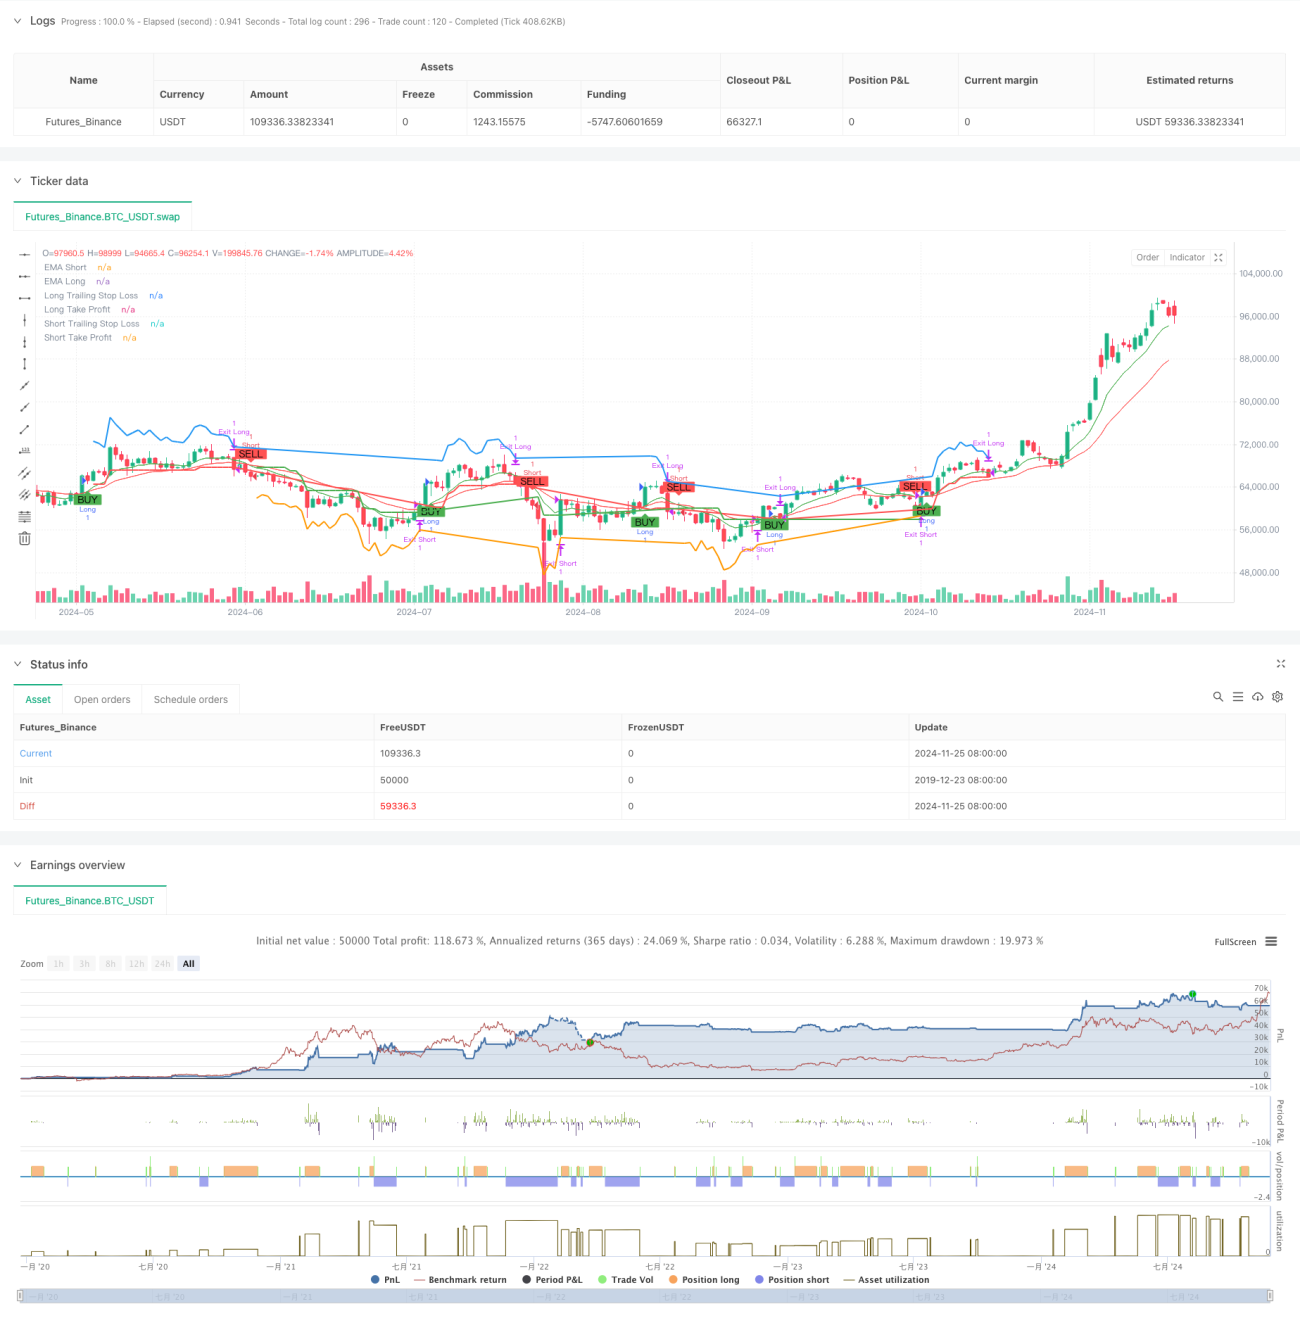
Ini adalah strategi pengesanan trend yang menggabungkan analisis pelbagai kitaran dan pengurusan kadar turun naik. Inti strategi ini menggunakan arah trend yang diadili oleh dua garis lurus yang sama, penyaringan overbought dan oversold melalui indikator RSI, pengenalan EMA jangka masa yang lebih tinggi untuk mengesahkan trend keseluruhan, dan menggunakan indikator ATR untuk mengawal secara dinamik sasaran berhenti dan keuntungan.
Prinsip Strategi
Logik perdagangan strategi ini terbahagi kepada beberapa bahagian utama:
- Pengiktirafan trend: Menggunakan persilangan EMA jangka pendek dan jangka panjang untuk mengenal pasti perubahan trend, menghasilkan isyarat ganda apabila EMA jangka pendek dikenakan EMA jangka panjang, menghasilkan isyarat kosong apabila dikenakan.
- Pengesahan trend: memperkenalkan EMA pada tempoh masa yang lebih tinggi sebagai penapis trend, hanya dibenarkan melakukan lebih banyak apabila harga berada di atas EMA pada tempoh masa yang tinggi, sebaliknya dibenarkan melakukan lebih sedikit.
- Penapisan kadar turun naik: menggunakan indikator RSI untuk membuat penilaian overbought dan oversold, untuk mengelakkan masuk ke dalam keadaan terlalu mengejar dan membunuh penurunan.
- Pengurusan Kedudukan: Berdasarkan ATR yang ditetapkan secara dinamik untuk tujuan berhenti dan keuntungan, dengan penyesuaian automatik kedudukan berhenti dan kerugian dengan perubahan harga, perlindungan kedua-duanya menguntungkan.
- Perlindungan berbilang dimensi: Strategi membina sistem keputusan perdagangan yang lengkap melalui penggunaan berbilang petunjuk teknikal.
Kelebihan Strategik
- Kebolehpercayaan isyarat yang tinggi: Dengan penggunaan gabungan pelbagai petunjuk teknikal, kebolehpercayaan isyarat perdagangan meningkat dengan ketara.
- Kawalan risiko yang sempurna: menggunakan pelan hentian dinamik berasaskan ATR, dapat menyesuaikan kedudukan hentian mengikut turun naik pasaran.
- Pengesanan Trend: Menggunakan kaedah analisis pelbagai kitaran untuk meningkatkan ketepatan penilaian trend utama.
- Fleksibiliti sasaran keuntungan: tetapan take-profit juga berdasarkan pada penyesuaian dinamik ATR, yang tidak akan meninggalkan permainan terlalu awal sambil memastikan keuntungan.
- Adaptif: Parameter strategi boleh diselaraskan dan dapat disesuaikan dengan keadaan pasaran yang berbeza.
Risiko Strategik
- Risiko pasaran yang bergolak: Perdagangan yang kerap boleh menyebabkan kerugian dalam keadaan yang bergolak.
- Risiko slippage: Dalam tempoh turun naik yang kuat, harga sebenar mungkin jauh berbeza dengan harga teori.
- Risiko penembusan palsu: mungkin berlaku pembalikan selepas penembusan jangka pendek, yang menyebabkan kerugian.
- Sensitiviti parameter: kombinasi parameter yang berbeza mempunyai kesan yang besar terhadap prestasi strategi dan memerlukan ujian yang lengkap.
Arah pengoptimuman strategi
- Pengesanan keadaan pasaran: penambahan penunjuk kekuatan trend, pengurangan automatik kedudukan atau penghentian perdagangan di pasaran yang bergolak.
- Optimasi masa masuk: boleh menggabungkan penunjuk lalu lintas untuk meningkatkan kebolehpercayaan isyarat masuk.
- Penyesuaian parameter dinamik: boleh menyesuaikan kitaran EMA dan kelipatan ATR secara automatik mengikut turun naik pasaran.
- Skim pembinaan dan pengurangan gudang secara berturut-turut: mekanisme pembinaan dan pengurangan gudang secara berturut-turut boleh direka untuk mengurangkan risiko satu titik harga.
- Pengurusan kedudukan yang dioptimumkan: saiz pegangan boleh disesuaikan berdasarkan risiko akaun dan pergerakan turun naik pasaran.
ringkaskan
Ini adalah strategi pengesanan trend yang direka dengan baik, dengan analisis pelbagai kitaran dan pengurusan kadar turun naik untuk mewujudkan ciri-ciri keuntungan risiko yang lebih baik. Kelebihan utama strategi ini adalah gabungan organik pelbagai petunjuk teknikal, yang menjamin kebolehpercayaan perdagangan dan mengawal risiko dengan berkesan. Walaupun terdapat beberapa risiko yang berpotensi, tetapi dengan pengoptimuman dan penyempurnaan yang berterusan, prestasi keseluruhan strategi masih boleh ditingkatkan.
- 1