Strategi perdagangan penyesuaian yang menggabungkan penjejakan dan volum dan harga silang berbilang penunjuk arah aliran

Gambaran keseluruhan
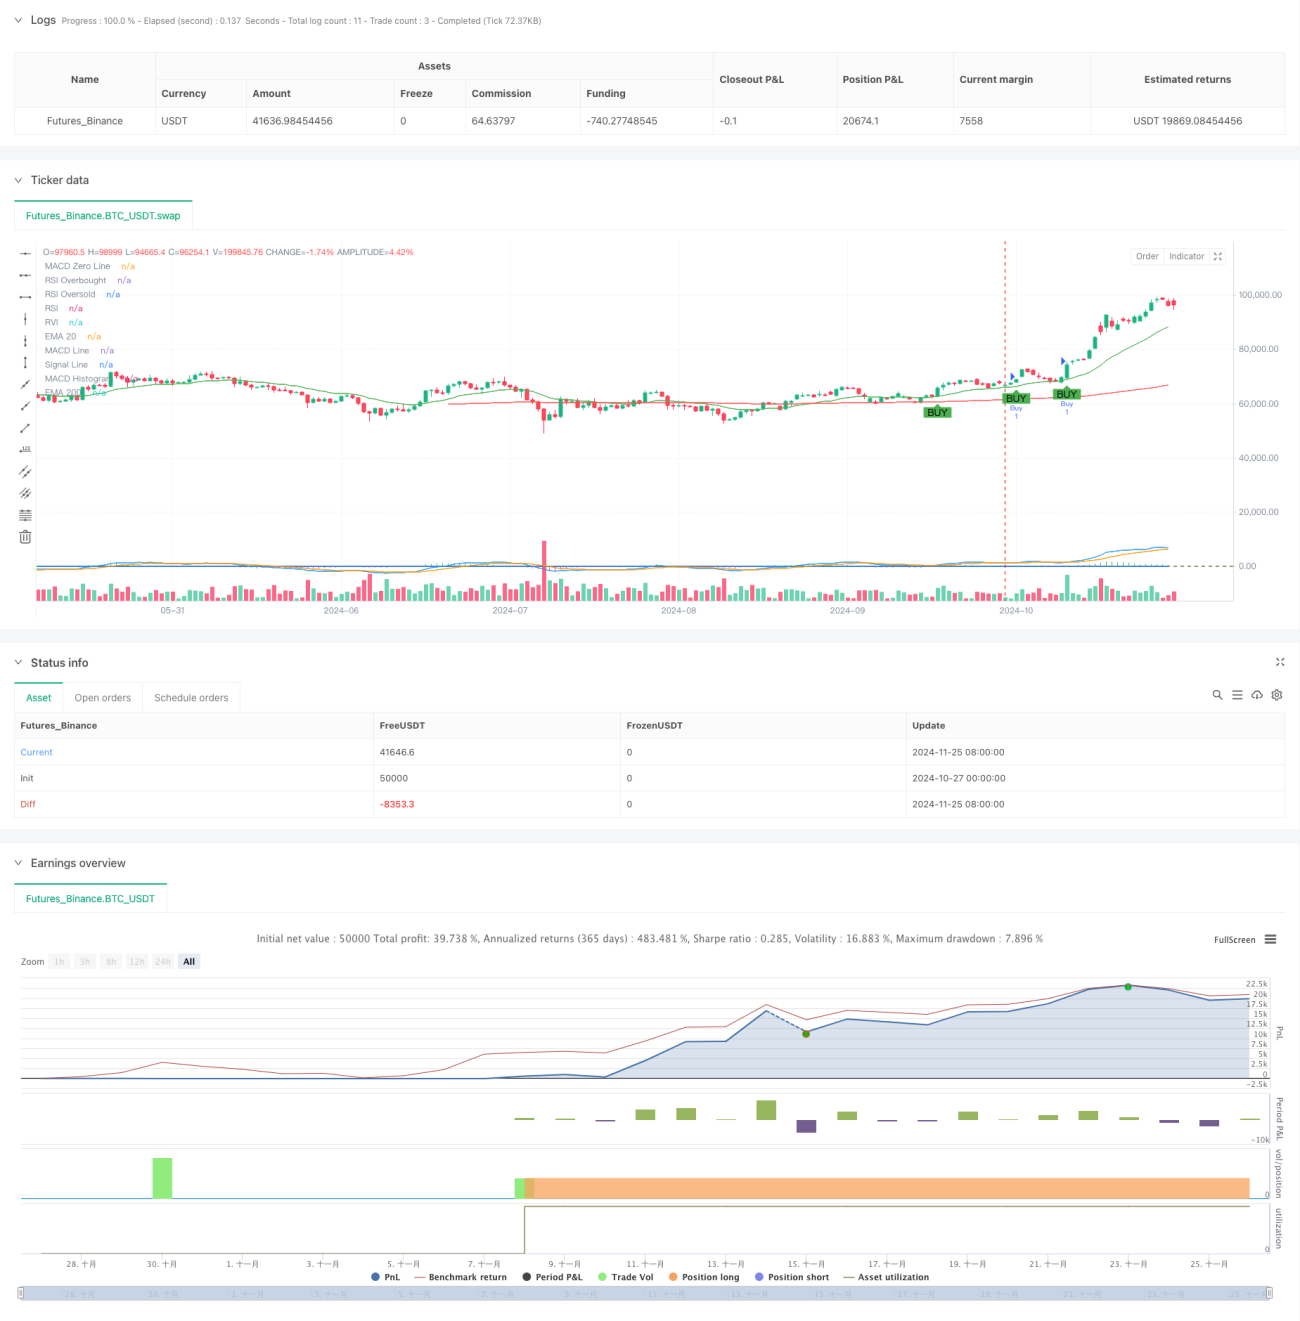
Strategi ini adalah sistem perdagangan trend-tracking yang menggabungkan pelbagai petunjuk teknikal, mengenal pasti trend pasaran melalui isyarat silang indikator seperti MACD, RSI, RVI, EMA, dan pengesahan jumlah transaksi, dan menggunakan tracking stop loss untuk menguruskan risiko. Strategi ini beroperasi dalam julat harga tertentu, meningkatkan ketepatan dan kebolehpercayaan perdagangan dengan penilaian gabungan pelbagai isyarat.
Prinsip Strategi
Strategi ini menggunakan mekanisme pengesahan isyarat bertingkat, yang terdiri daripada beberapa komponen utama: pertama, menggunakan purata bergerak indeks ((EMA) selama 20 dan 200 kitaran untuk menentukan trend pasaran keseluruhan; kedua, menggunakan penyambungan MACD ((12,26,9) untuk menangkap titik perpindahan trend; ketiga, menggunakan indikator yang agak kuat ((RSI) dan indikator yang agak bergolak ((RVI) untuk mengesahkan keadaan pasaran yang terlalu banyak dibeli dan terlalu banyak dijual; dan terakhir, melakukan pengesahan perdagangan melalui indikator transaksi. Syarat pembelian perlu dipenuhi pada masa yang sama:
Kelebihan Strategik
- Sistem pengesahan pelbagai isyarat mengurangkan risiko penembusan palsu
- Gabungan trend tracking dan indikator getaran untuk mengekalkan kestabilan dalam keadaan pasaran yang berbeza
- Meningkatkan kebolehpercayaan isyarat perdagangan melalui pengesahan jumlah transaksi
- Mekanisme Tracking Stop Loss berkesan melindungi keuntungan yang telah diperoleh
- Pengekangan julat harga dapat mengelakkan perdagangan berlebihan dalam keadaan yang melampau
- Parameter penunjuk boleh disesuaikan secara fleksibel mengikut keadaan pasaran
- Sistem ini mempunyai skalabiliti yang baik dan adaptasi
Risiko Strategik
- Syarat yang berlainan boleh menyebabkan kehilangan peluang perdagangan yang penting
- Isyarat palsu yang mungkin berlaku dalam pasaran yang bergolak
- Pengekangan dalam julat harga tetap boleh menyebabkan strategi kehilangan peluang penting untuk mencapai kejayaan
- Terlalu banyak bergantung kepada petunjuk teknikal mungkin mengabaikan kesan asas
- Tracking stop boleh diaktifkan terlalu awal apabila berlaku turun naik yang teruk
Arah pengoptimuman strategi
- Memperkenalkan mekanisme parameter penyesuaian diri, menyesuaikan parameter setiap penunjuk mengikut kadar turun naik pasaran yang dinamik
- Menambah Indeks Sentimen Pasaran untuk Meningkatkan Keupayaan Memprediksi Titik Peralihan Pasaran
- Membangunkan mekanisme penilaian harga yang dinamik untuk menjadikan strategi lebih fleksibel
- Menambah penapis kitaran masa untuk mengelakkan dagangan pada masa yang tidak menguntungkan
- Mengoptimumkan mekanisme penangguhan kerugian, pertimbangkan untuk memperkenalkan penangguhan dinamik berdasarkan kadar turun naik
- Menambah modul pengurusan risiko untuk pengurusan kedudukan yang lebih baik
ringkaskan
Strategi ini membina sistem perdagangan yang agak lengkap dengan menggunakan kombinasi pelbagai petunjuk teknikal. Walaupun terdapat beberapa batasan, strategi ini mempunyai nilai praktikal yang baik dengan pengoptimuman parameter dan pengurusan risiko yang munasabah.
- 1