
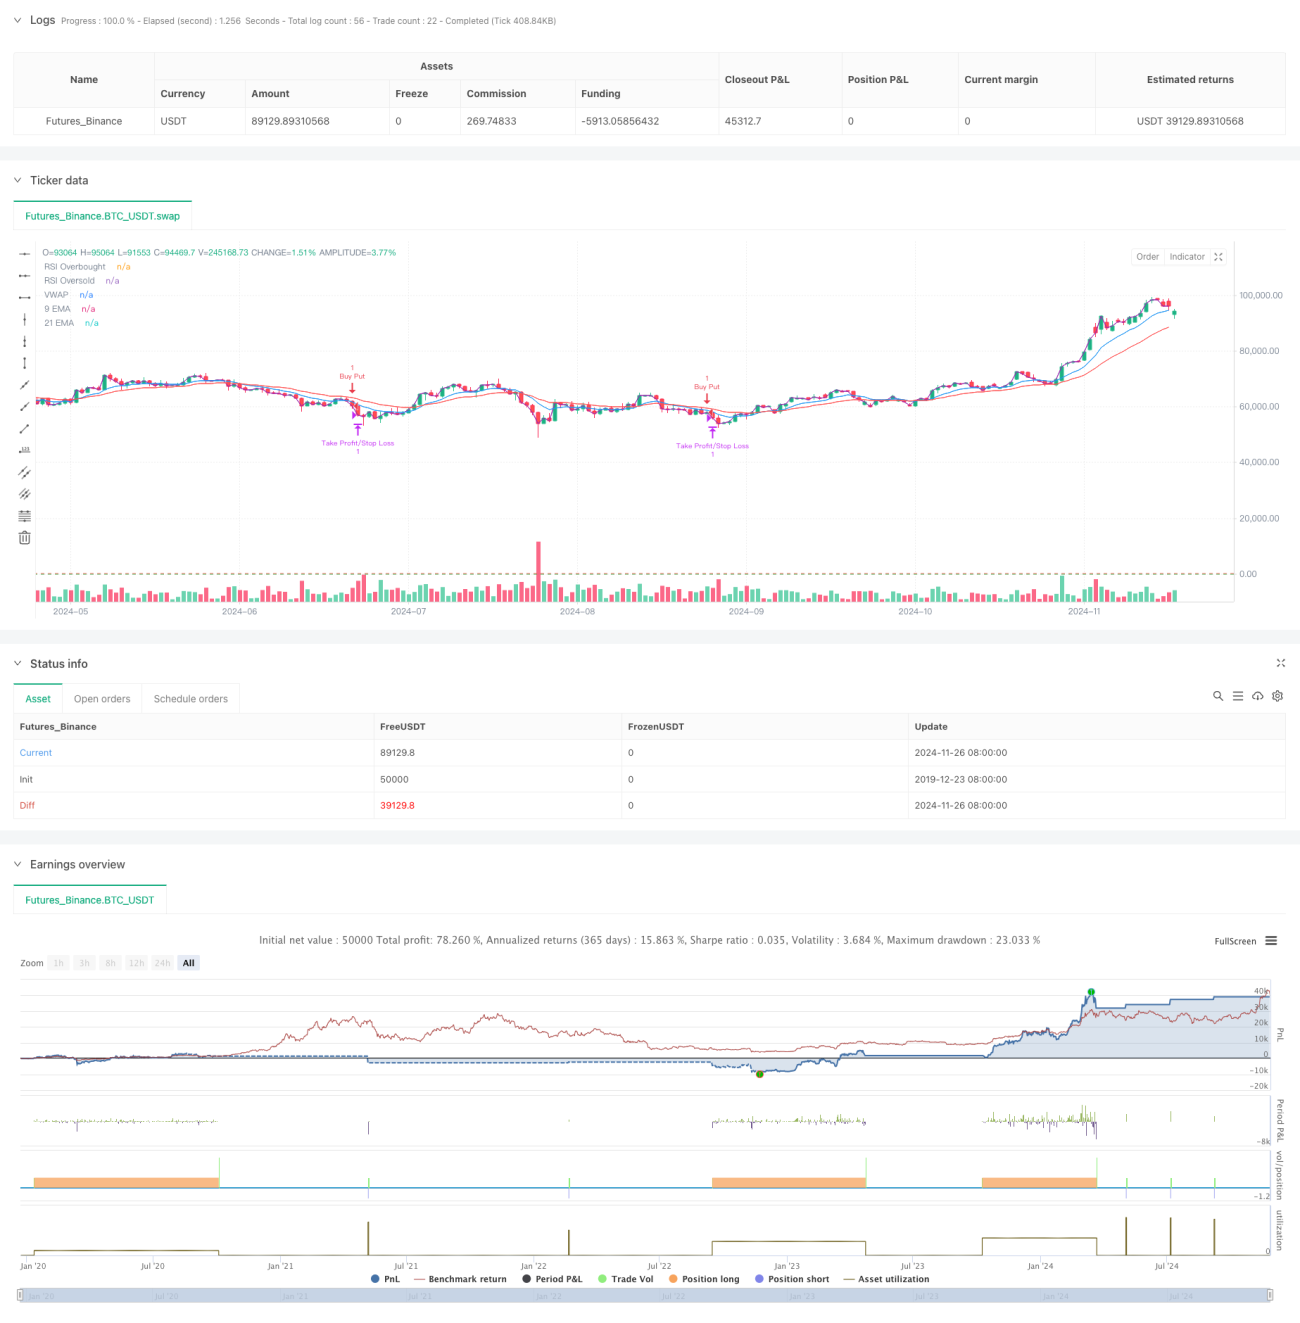
Gambaran keseluruhan
Strategi ini adalah sistem perdagangan frekuensi tinggi berdasarkan pelbagai petunjuk teknikal, menggunakan bingkai masa 5 minit, menggabungkan sistem linear, indikator dinamik dan analisis kuantiti transaksi. Strategi ini menyesuaikan diri dengan turun naik pasaran dengan cara penyesuaian dinamik, menggunakan pengesahan pelbagai isyarat untuk meningkatkan ketepatan dan kebolehpercayaan perdagangan.
Prinsip Strategi
Strategi ini menggunakan sistem dua garis rata-rata ((9 kitaran dan 21 kitaran EMA) sebagai alat penilaian trend utama, dan digabungkan dengan RSI untuk pengesahan pergerakan. Apabila harga berada di atas garis rata-rata dua dan RSI berada di antara 40-65, sistem akan mencari peluang yang lebih banyak; apabila harga berada di bawah garis rata-rata dua dan RSI berada di antara 35-60, sistem akan mencari peluang yang kosong.
Kelebihan Strategik
- Mekanisme pengesahan pelbagai isyarat meningkatkan kebolehpercayaan transaksi dengan ketara
- Tetapan Stop Loss Dinamik yang dapat disesuaikan dengan keadaan pasaran yang berbeza
- Menggunakan RSI yang lebih konservatif untuk mengelakkan perdagangan di zon ekstrem
- Mekanisme pengesahan pesanan menapis isyarat palsu dengan berkesan
- Penggunaan VWAP membantu memastikan arah transaksi selaras dengan dana arus perdana
- Sistem linear yang cepat bertindak balas sesuai untuk menangkap peluang pasaran jangka pendek
Risiko Strategik
- Sinyal palsu yang sering berlaku dalam pasaran yang bergolak
- Pembatasan berbilang syarat mungkin menyebabkan kehilangan sebahagian peluang perdagangan
- Perdagangan frekuensi tinggi mungkin menghadapi kos transaksi yang lebih tinggi
- Mungkin lambat bertindak balas apabila pasaran berubah dengan cepat
- Keperluan yang lebih tinggi untuk realiti data pasaran
Arah pengoptimuman strategi
- Memperkenalkan mekanisme penyesuaian parameter yang menyesuaikan diri, membolehkan strategi menyesuaikan parameter penunjuk mengikut keadaan pasaran yang dinamik
- Menambah modul untuk mengenal pasti keadaan pasaran, menggunakan strategi perdagangan yang berbeza dalam keadaan pasaran yang berbeza
- Untuk mengoptimumkan keadaan penapisan kuantiti lalu lintas, pertimbangkan untuk menggunakan kuantiti lalu lintas relatif atau analisis profil kuantiti lalu lintas
- Memperbaiki mekanisme henti rugi, boleh dipertimbangkan untuk menambah fungsi henti rugi yang dijejaki
- Menambah penapis masa dagangan untuk mengelakkan masa pembukaan dan penutupan yang bergolak
ringkaskan
Strategi ini membina sistem perdagangan yang agak lengkap dengan menggunakan kombinasi pelbagai petunjuk teknikal. Kelebihan strategi ini adalah mekanisme pengesahan isyarat berbilang dimensi dan kaedah kawalan risiko yang dinamik. Walaupun terdapat beberapa risiko yang berpotensi, strategi ini masih mempunyai nilai aplikasi yang baik dengan pengoptimuman parameter dan pengurusan risiko yang munasabah.
- 1