Strategi Perdagangan Momentum Trend RSI Digabungkan dengan Purata Pergerakan Dwi dan Pengesahan Volum

Gambaran keseluruhan
Strategi ini adalah strategi pengesanan trend berdasarkan isyarat oversold RSI, trend garis rata-rata jangka pendek dan pengesahan jumlah transaksi. Ia terutamanya membina kedudukan berbilang dengan mengenal pasti peluang oversold jangka pendek dalam trend kenaikan jangka panjang, sambil menggunakan pembesaran transaksi untuk mengesahkan keberkesanan isyarat perdagangan.
Prinsip Strategi
Logik utama strategi ini adalah berdasarkan kepada tiga syarat utama iaitu:
- RSI oversold signal ((RSI<=30): digunakan untuk menangkap peluang untuk melabur dalam pasaran
- Berbilang-kepala di bawah SMA250> SMA500: mengesahkan trend naik jangka panjang
- Pengesahan jumlah transaksi ((Kumpulan transaksi semasa> 20 pusingan purata jumlah transaksi*2.5): mengesahkan keberkesanan perubahan harga
Apabila ketiga-tiga syarat di atas dipenuhi secara bersamaan, strategi memasuki kedudukan berbilang mata. Isyarat kedudukan kosong dipicu oleh garis rata-rata jangka pendek di bawah garis rata-rata jangka panjang ((dead fork)). Pada masa yang sama, strategi menetapkan 5% stop loss untuk mengawal risiko.
Kelebihan Strategik
- Mekanisme pengesahan berganda mengurangkan isyarat palsu: gabungan RSI, garisan rata-rata dan penapisan tiga kali jumlah transaksi, meningkatkan kebolehpercayaan isyarat perdagangan dengan ketara
- Ciri-ciri mengikuti trend: menilai trend besar dengan garis purata jangka panjang, dan mengelakkan dagangan berlawanan arah
- Pengendalian risiko yang sempurna: Tetapkan titik berhenti tetap, mengawal risiko perdagangan tunggal dengan berkesan
- Ketabahan: parameter strategi boleh disesuaikan dengan ciri-ciri pasaran yang berbeza
- Penyaringan ketat untuk peluang perdagangan: penyaringan pelbagai syarat memastikan hanya masuk pada masa yang terbaik
Risiko Strategik
- Risiko ketinggalan: Rata-rata jangka panjang ketinggalan yang ketara, mungkin terlepas trend awal
- Risiko berlebihan: Syarat-syarat ketat dan pelbagai mungkin terlepas beberapa peluang perdagangan yang berkesan
- Risiko pasaran yang bergolak: mungkin sering mencetuskan isyarat palsu dalam pasaran yang bergolak
- Setup risiko stop loss: Stop loss peratusan tetap mungkin tidak sesuai untuk semua keadaan pasaran
- Risiko pengoptimuman parameter: Pengoptimuman berlebihan boleh menyebabkan strategi berprestasi buruk dalam dagangan sebenar.
Arah pengoptimuman strategi
- Pengoptimuman hentian dinamik: mekanisme hentian dinamik berdasarkan ATR atau kadar turun naik boleh dipertimbangkan
- Kuantifikasi kekuatan trend: pengenalan penunjuk kekuatan trend seperti ADX, meningkatkan ketepatan penilaian trend
- Pengurusan kedudukan yang dioptimumkan: Peratusan pegangan yang disesuaikan mengikut kekuatan isyarat dan pergerakan kadar pasaran
- Penambahbaikan mekanisme keluar: mekanisme keluar yang fleksibel seperti peningkatan sasaran keuntungan dan pelepasan kerugian bergerak
- Penapisan masa: Tambah penapisan masa untuk mengelakkan masa perdagangan yang tidak cekap
ringkaskan
Ini adalah strategi trend-following yang dirancang dengan logik dan logik yang ketat, dengan penggunaan gabungan pelbagai petunjuk teknikal, menyeimbangkan keuntungan dan risiko dengan berkesan. Kelebihan utama strategi ini adalah mekanisme pengesahan isyarat yang baik dan sistem kawalan risiko, tetapi juga menghadapi cabaran seperti kelebihan dan ketinggalan. Dengan arah pengoptimuman yang disyorkan, strategi ini dijangka dapat mencapai prestasi yang lebih baik dalam aplikasi sebenar.
/*backtest
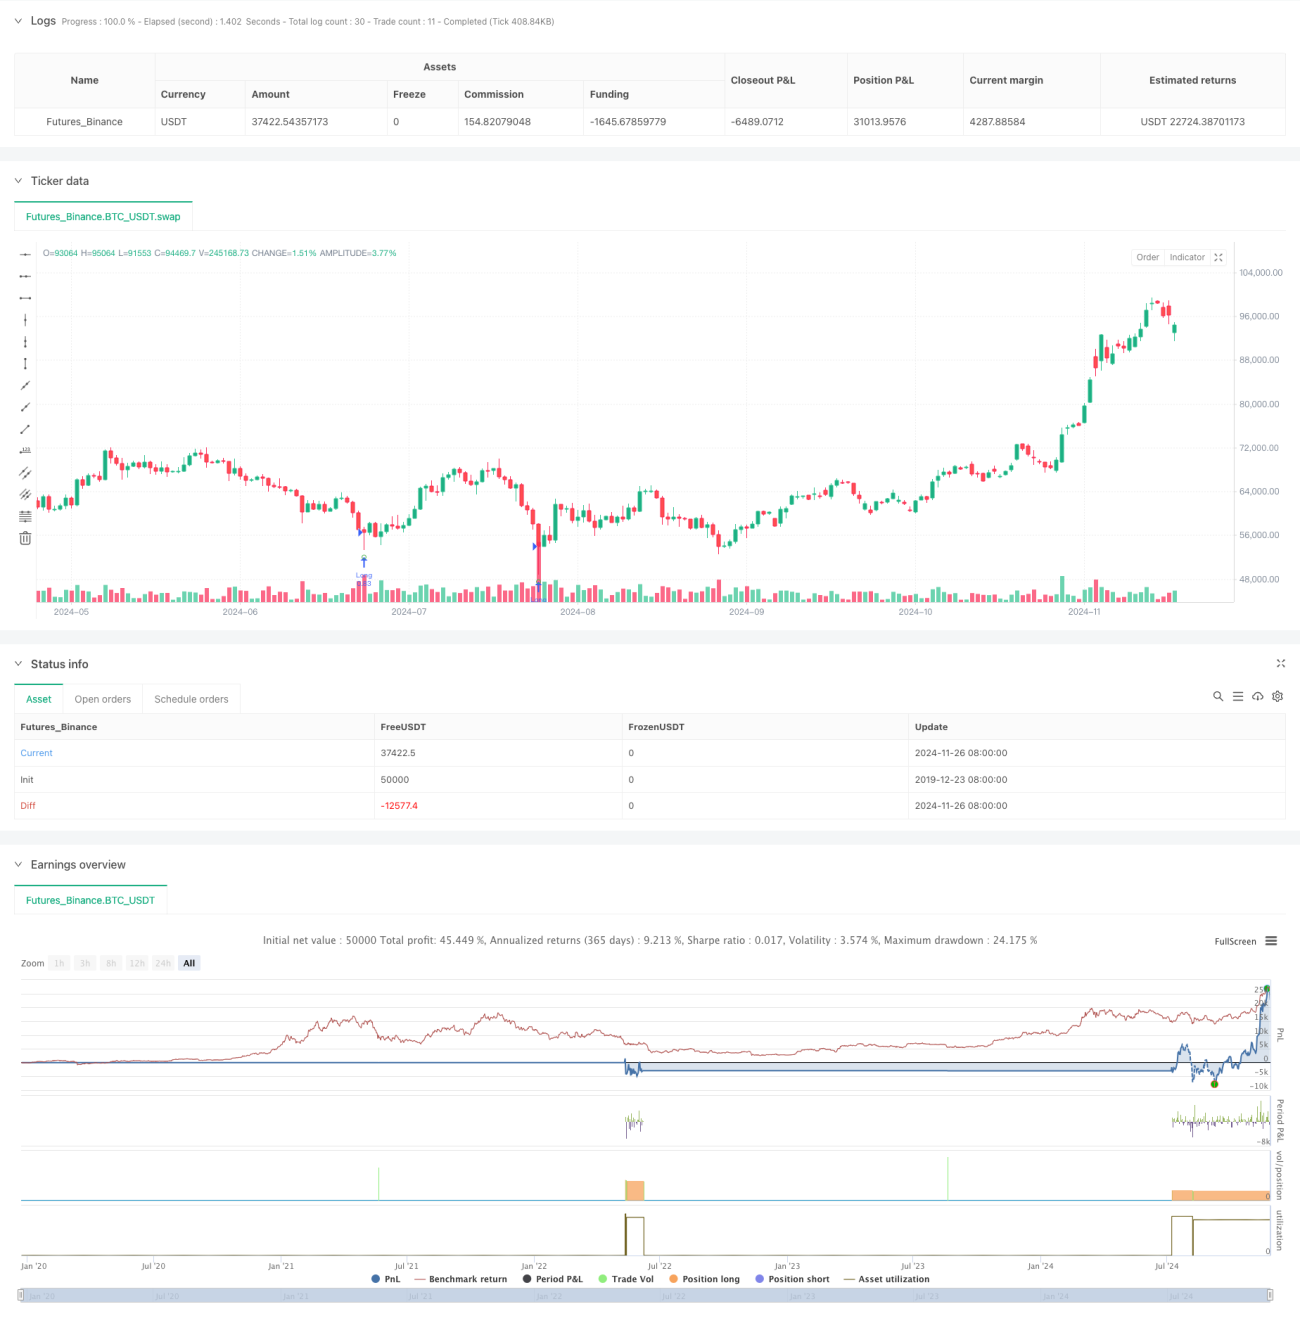
start: 2019-12-23 08:00:00
end: 2024-11-27 00:00:00
period: 1d
basePeriod: 1d
exchanges: [{"eid":"Futures_Binance","currency":"BTC_USDT"}]
*/
// This work is licensed under a Attribution-NonCommercial-ShareAlike 4.0 International (CC BY-NC-SA 4.0) https://creativecommons.org/licenses/by-nc-sa/4.0/
// © wielkieef
- 1