
Gambaran keseluruhan
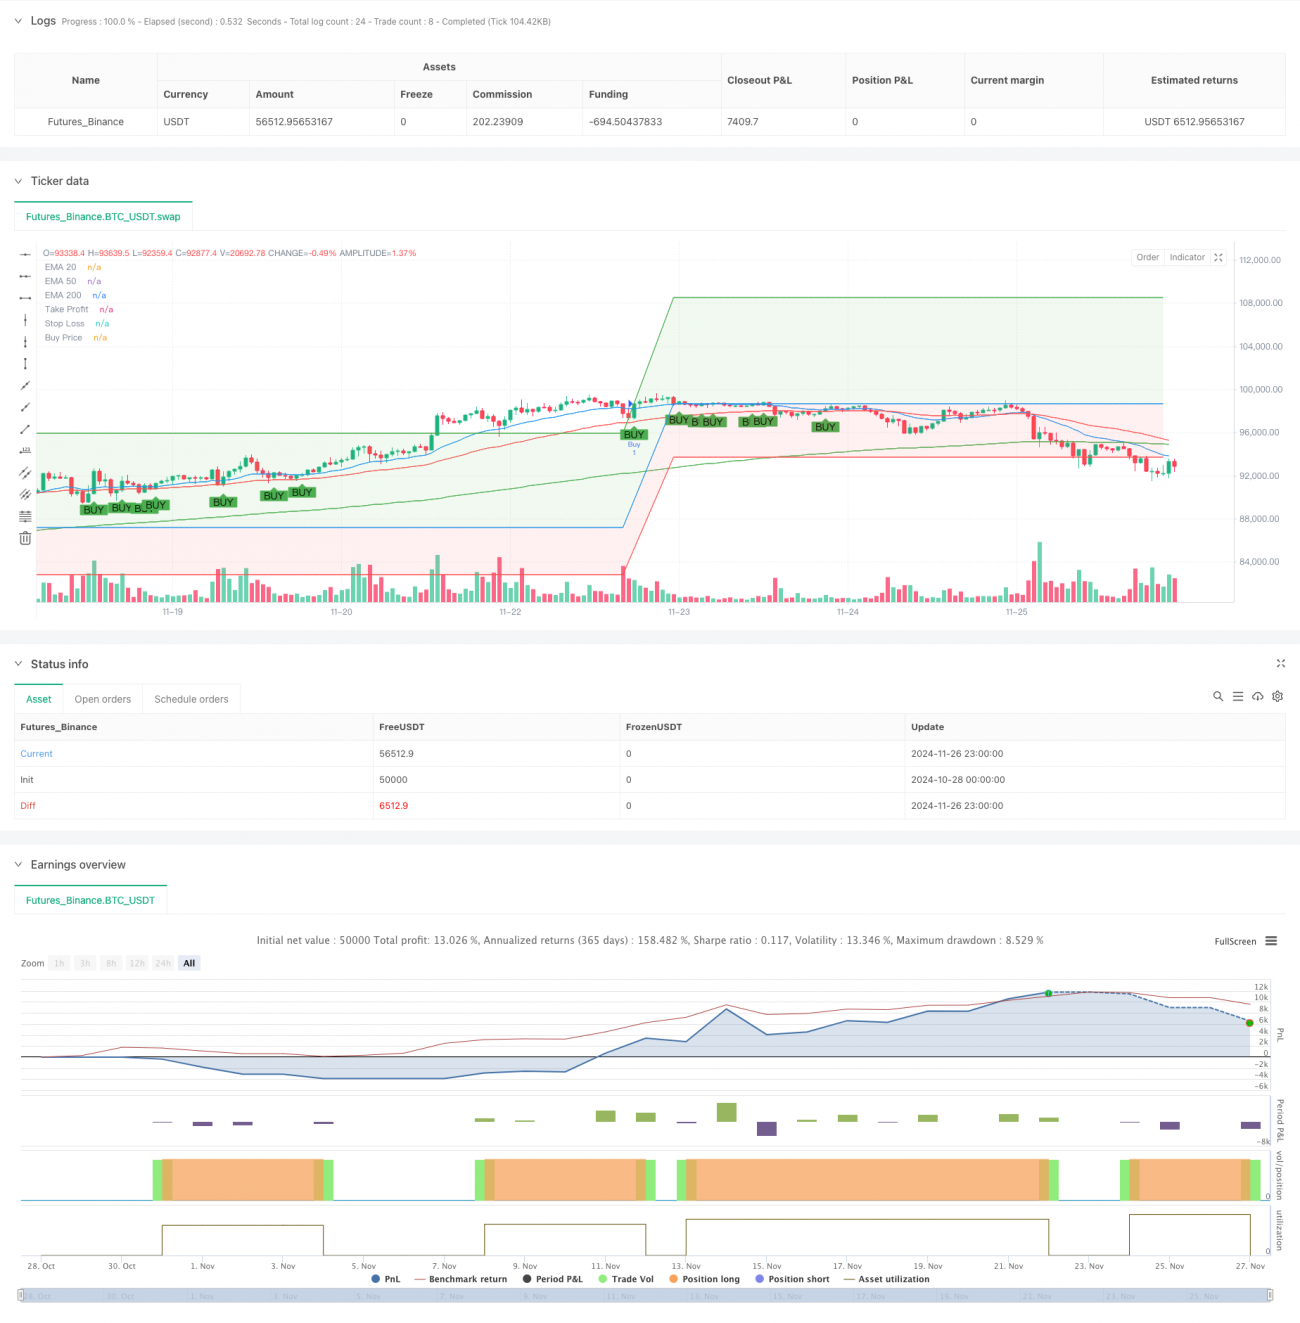
Ini adalah strategi pemantauan trend berdasarkan persilangan garis rata-rata berkala. Strategi ini berdasarkan pada hubungan persilangan antara indeks bergerak 20, 50 dan 200 kitaran rata-rata ((EMA) untuk menentukan masa masuk dan hubungan harga dengan garis rata-rata, sambil menetapkan stop loss berdasarkan peratusan untuk mengawal risiko. Strategi ini sangat sesuai untuk tempoh masa yang lebih besar, seperti grafik 1 jam, hari dan mingguan, yang dapat menangkap tren jangka panjang dan jangka panjang.
Prinsip Strategi
Logik teras strategi ini adalah berdasarkan kepada sistem garis purata berganda dan analisis tingkah laku harga:
- Membina sistem penghakiman trend menggunakan purata bergerak indeks tiga tempoh yang berbeza ((20, 50, 200)
- Syarat kemasukan adalah memenuhi semua syarat berikut:
- Harga melepasi dan ditutup di atas EMA 20 kitaran
- 20 kitaran EMA terletak di atas 50 kitaran EMA
- EMA 50 kitaran terletak di atas EMA 200 kitaran
- Pengendalian risiko menggunakan peratusan tetap:
- Penangguhan ditetapkan 10% di atas harga kemasukan
- Stop loss set pada 5% di bawah harga permulaan
Kelebihan Strategik
- Meningkatkan kebolehpercayaan mekanisme pengesahan berbilang
- Pembuktian berganda melalui Triple Mean Line dan Price Breakthrough
- Mengelakkan gangguan isyarat palsu
- Sistem kawalan risiko yang baik
- Preset Stop Stop Stop
- Risiko dan ganjaran adalah munasabah (~1:2)
- Sangat boleh menyesuaikan diri
- Boleh digunakan untuk pelbagai tempoh masa
- Terutama sesuai untuk perdagangan trend jangka menengah dan panjang
Risiko Strategik
- Keadaan di bursa saham kurang baik
- Mungkin sering mencetuskan kerugian di pasaran yang bergolak
- Disyorkan untuk digunakan apabila trend jelas
- Risiko ketinggalan zaman
- Sistem Linear mempunyai ketidakselesaan
- Mungkin saya terlepas beberapa titik permulaan.
- Had Stop Loss Tetap
- Peratusan tetap mungkin tidak sesuai untuk semua keadaan pasaran
- Cadangan untuk disesuaikan dengan kadar turun naik
Arah pengoptimuman strategi
- Memperkenalkan Petunjuk Kemeruapan
- Mengubah Stop Loss dengan ATR secara dinamik
- Peningkatan kesesuaian strategi dengan pasaran
- Penapisan intensiti trend meningkat
- Tambah ADX dan lain-lain
- Meningkatkan kualiti isyarat masuk
- Optimumkan kitaran rata-rata
- Menyesuaikan parameter garis purata mengikut ciri-ciri pasaran yang berbeza
- Menyediakan cadangan optimasi parameter
ringkaskan
Ini adalah strategi untuk mengesan trend yang dirancang dengan logik dan logik yang jelas. Dengan penggunaan gabungan pelbagai petunjuk teknikal, ia memastikan kebolehpercayaan strategi dan menyediakan rancangan kawalan risiko yang jelas. Strategi ini sangat sesuai untuk beroperasi pada carta berkala besar dan mempunyai kelebihan yang unik untuk memahami trend jangka panjang dan jangka panjang. Dengan arah pengoptimuman yang disyorkan, strategi ini dapat ditingkatkan lagi.
- 1